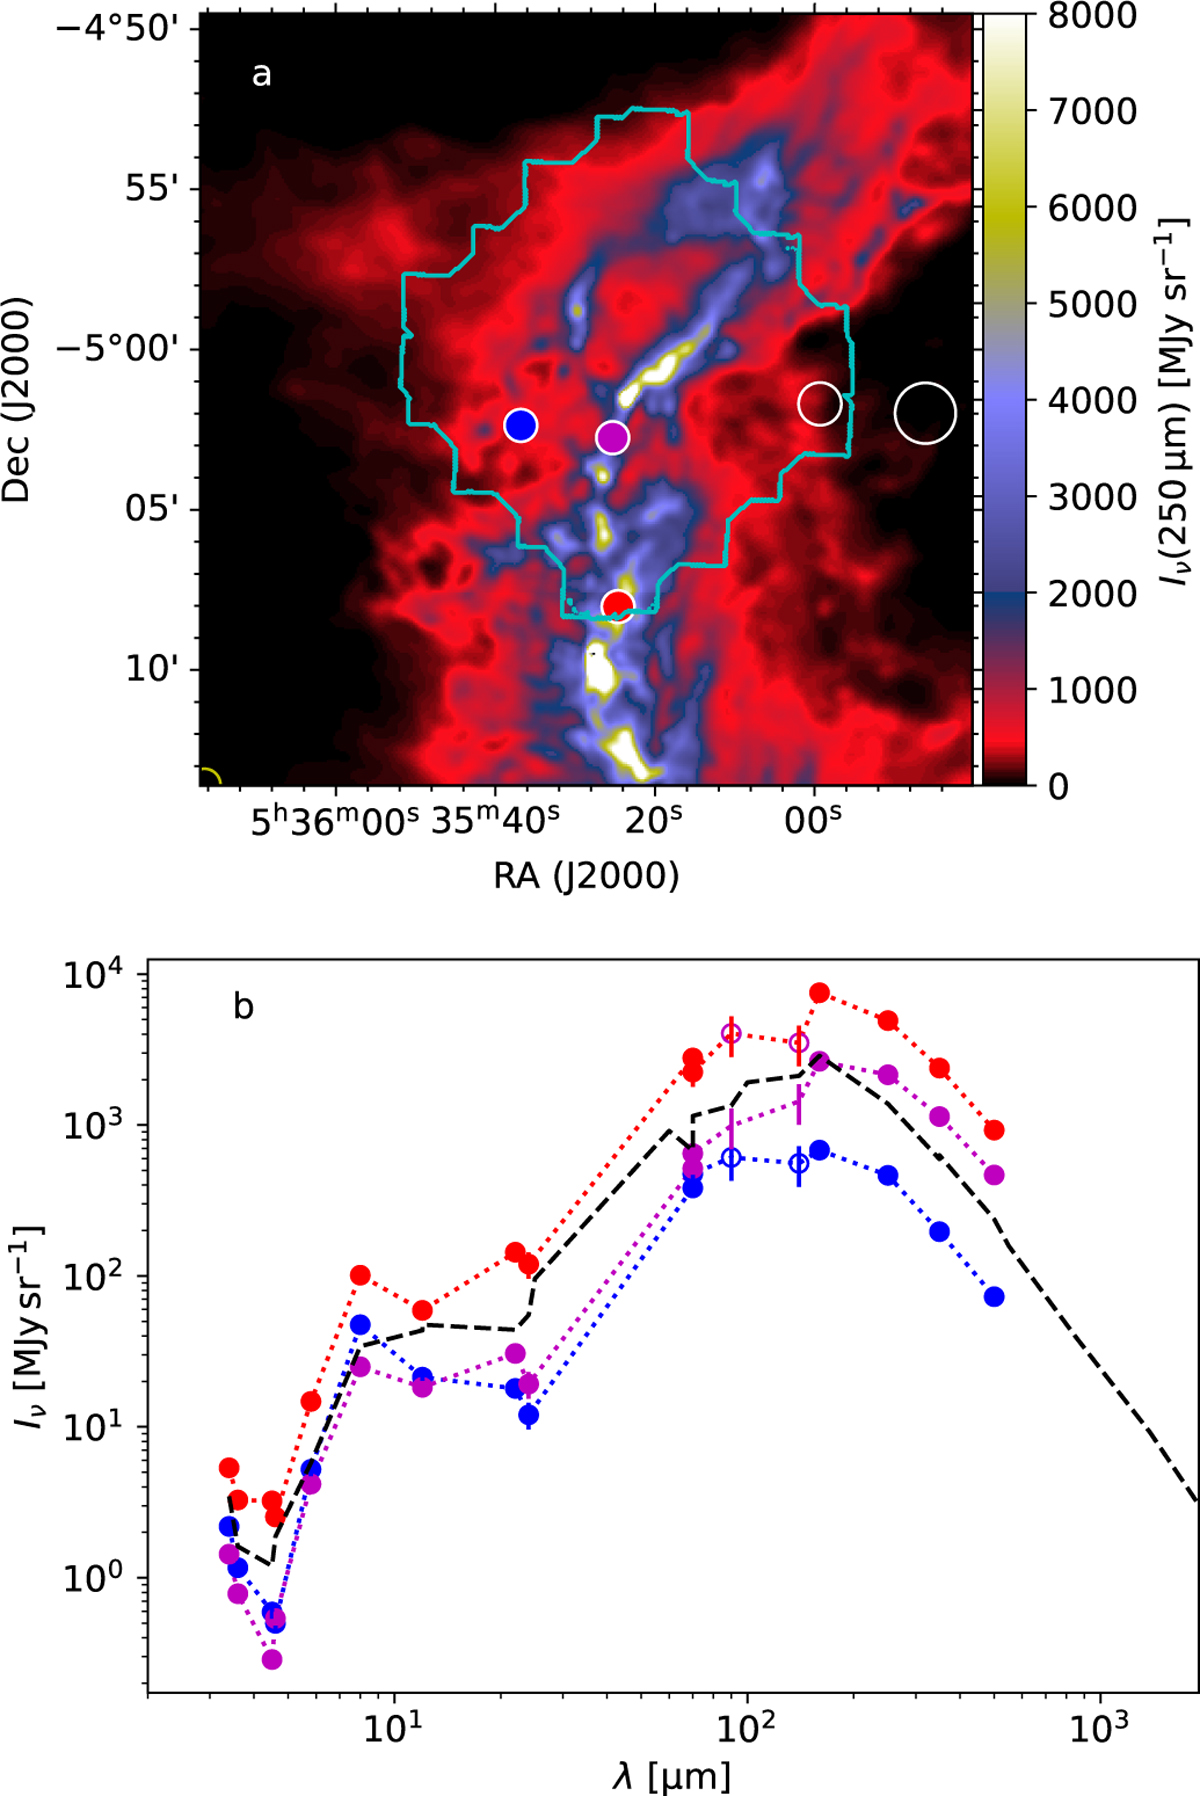
Fig. A.1
Download original image
Sample spectra in OMC-3 field. Frame a shows the Herschel 250 μm map and the outline of the PACS coverage. The white circles indicate the reference area used for background subtraction. Frame b shows spectra for background-subtracted data at the positions marked in frame a with blue, magenta, and red circles. The data correspond to 1’ (solid symbols; Spitzer, WISE, Herschel) or 2’ resolution (open symbols; AKARI, with 30% error bars). The average spectrum over the PACS coverage is drawn with a black dashed line.
Current usage metrics show cumulative count of Article Views (full-text article views including HTML views, PDF and ePub downloads, according to the available data) and Abstracts Views on Vision4Press platform.
Data correspond to usage on the plateform after 2015. The current usage metrics is available 48-96 hours after online publication and is updated daily on week days.
Initial download of the metrics may take a while.