Fig. B.2
Download original image
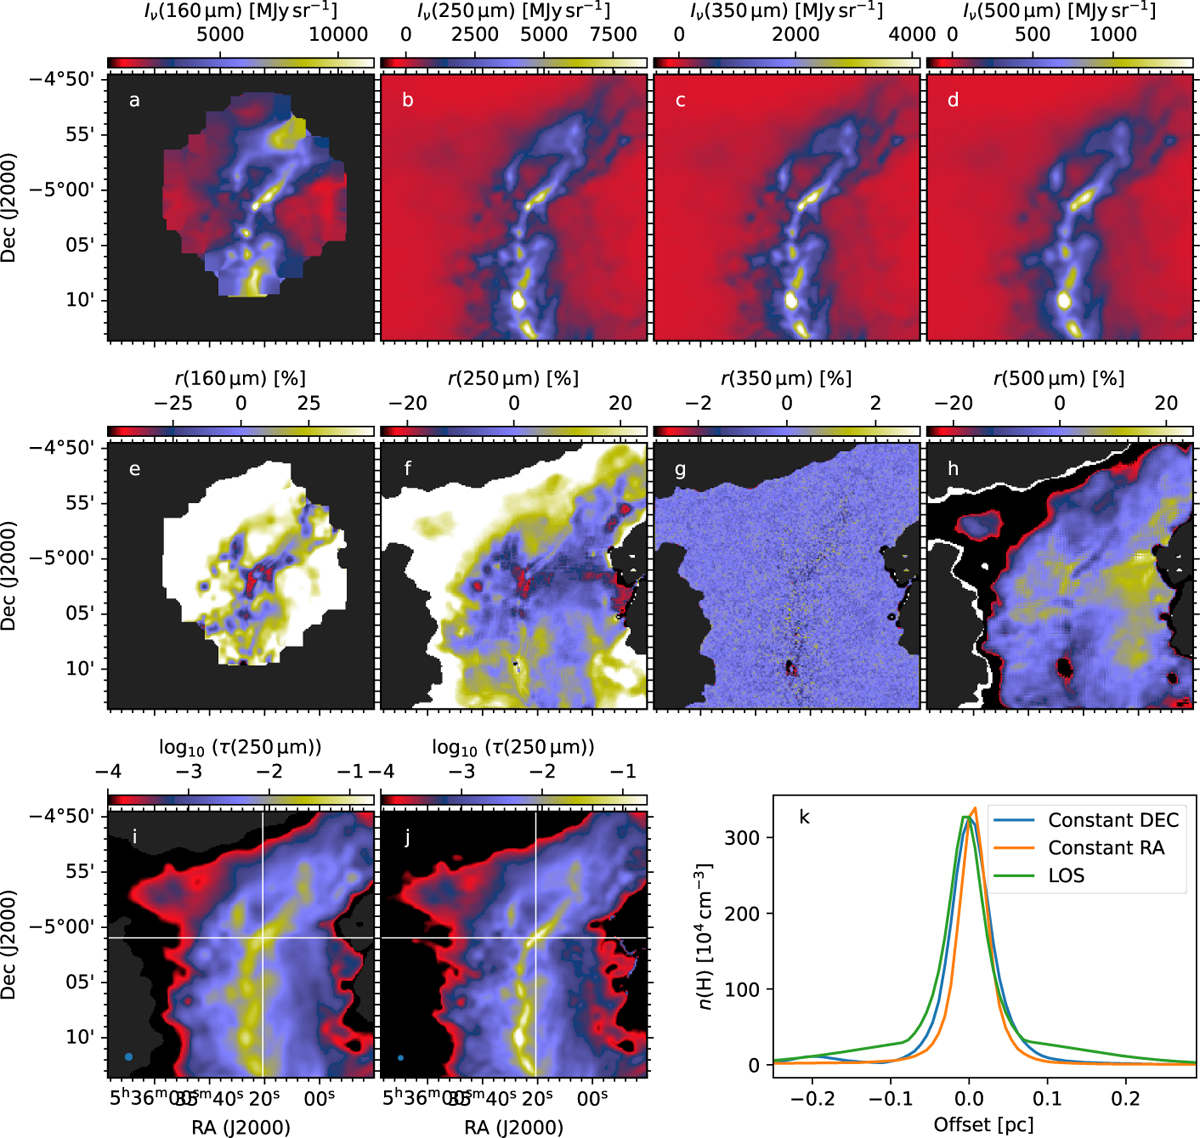
Results for cloud model B with ![]() 1 mag and a0=0.3 μm Mix 1 dust model. Frames a-d show the observed surface brightness maps and frames e-h the corresponding relative 160−500 μm residuals,
1 mag and a0=0.3 μm Mix 1 dust model. Frames a-d show the observed surface brightness maps and frames e-h the corresponding relative 160−500 μm residuals, ![]() . Frame i shows a map of the 250 μm optical depth from the direct MBB fitting of observations (41′′ resolution), and frame j shows the same for the fitted model (30′′ resolution). The last frame shows one-dimensional cross-sections of the model densities along the lines marked with white lines in the previous frames, along the LOS central plane of the model.
. Frame i shows a map of the 250 μm optical depth from the direct MBB fitting of observations (41′′ resolution), and frame j shows the same for the fitted model (30′′ resolution). The last frame shows one-dimensional cross-sections of the model densities along the lines marked with white lines in the previous frames, along the LOS central plane of the model.
Current usage metrics show cumulative count of Article Views (full-text article views including HTML views, PDF and ePub downloads, according to the available data) and Abstracts Views on Vision4Press platform.
Data correspond to usage on the plateform after 2015. The current usage metrics is available 48-96 hours after online publication and is updated daily on week days.
Initial download of the metrics may take a while.