Fig. B.3
Download original image
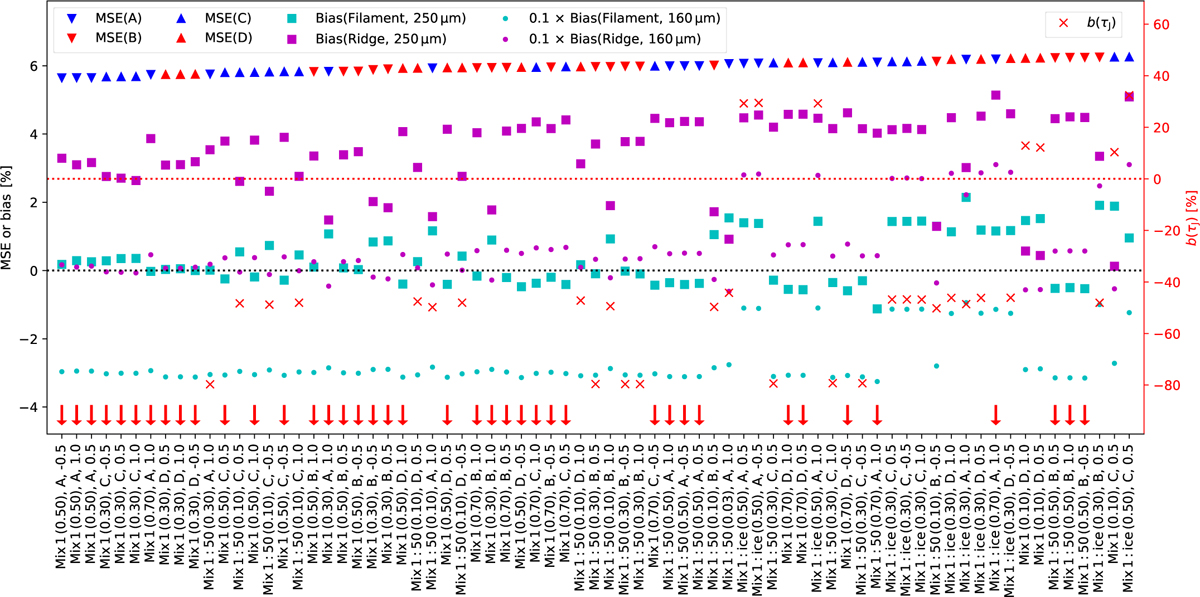
Best single-dust models in order of increasing MSE, based on average of 250 μm and 500 μm residuals in Q=1−2 areas. Each model is labelled by the combination of the dust and cloud names and the ![]() value. The MSE markers and their colours indicate the model versions A-D. The 250 μm and 160 μm bias values are also plotted using the left y-axis, separately for the filament (Q=1) and the ridge (Q=2) regions. The 160 μm bias values are scaled by 0.1 for the plotting. The red crosses and the right y-axis show the bias in the predicted J-band extinction, b(τJ)=(A(J, model)−A(J, obs.))/A(J, obs.) over the Q=1 area. A(J, obs.) is estimated using the extinction curve of the dust model in question and all stars in the filament region (Q=1). Red arrows indicate values outside the plotted range.
value. The MSE markers and their colours indicate the model versions A-D. The 250 μm and 160 μm bias values are also plotted using the left y-axis, separately for the filament (Q=1) and the ridge (Q=2) regions. The 160 μm bias values are scaled by 0.1 for the plotting. The red crosses and the right y-axis show the bias in the predicted J-band extinction, b(τJ)=(A(J, model)−A(J, obs.))/A(J, obs.) over the Q=1 area. A(J, obs.) is estimated using the extinction curve of the dust model in question and all stars in the filament region (Q=1). Red arrows indicate values outside the plotted range.
Current usage metrics show cumulative count of Article Views (full-text article views including HTML views, PDF and ePub downloads, according to the available data) and Abstracts Views on Vision4Press platform.
Data correspond to usage on the plateform after 2015. The current usage metrics is available 48-96 hours after online publication and is updated daily on week days.
Initial download of the metrics may take a while.