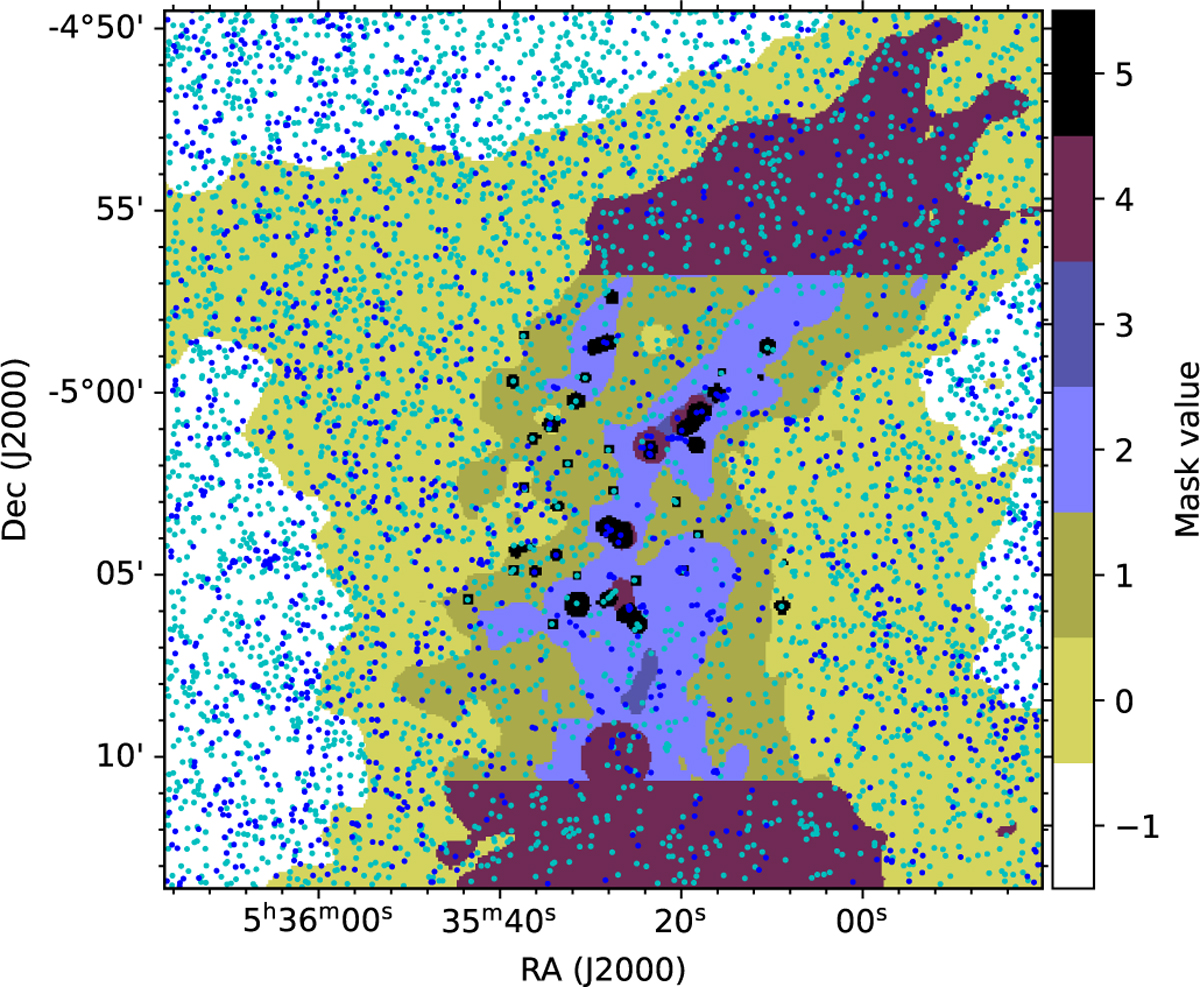
Fig. 2
Download original image
Masks for the OMC-3 field. The levels correspond to areas with low emission (Q=−1), extended cloud (Q=0), filament (Q=1), ridge (Q=2), bright parts of the ridge (Q=3), FIR point sources and highsurface brightness areas affected by local heating (Q=4), and MIR point sources (Q=5). The small dots correspond to the NIR star-like (cyan) and potentially extended (blue) sources that are the basis of the NIR extinction map (Meingast et al. 2016).
Current usage metrics show cumulative count of Article Views (full-text article views including HTML views, PDF and ePub downloads, according to the available data) and Abstracts Views on Vision4Press platform.
Data correspond to usage on the plateform after 2015. The current usage metrics is available 48-96 hours after online publication and is updated daily on week days.
Initial download of the metrics may take a while.