Fig. 3
Download original image
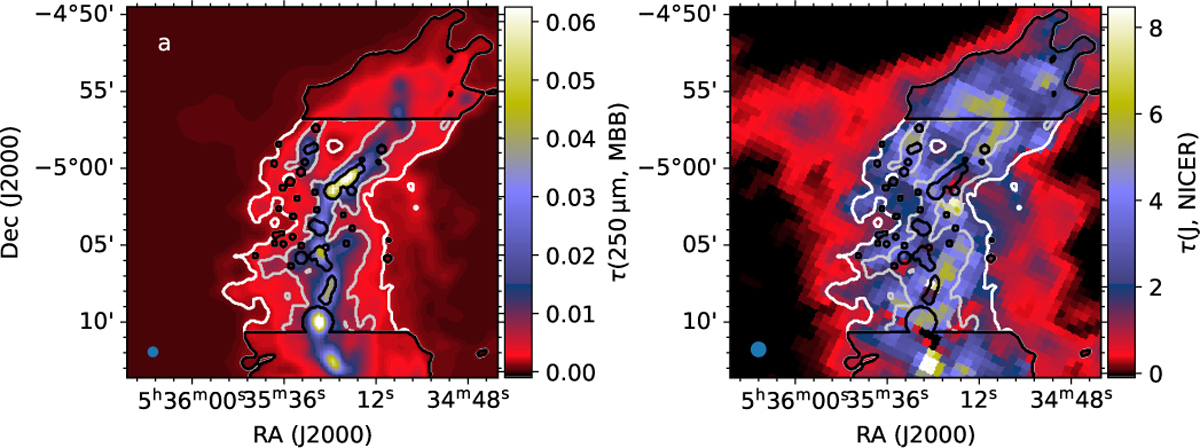
Comparison of τ(250 μm) optical depth map derived from Herschel observations at 41′′ resolution (frame a) and NICER extinction map of Meingast et al. (2016) at 1’ resolution (frame b). The white and grey contours show, respectively, the outlines of the filament (Q=1) and the ridge (Q=2) regions. The black contours separate other high column density areas that are excluded from the analysis (Q>2).
Current usage metrics show cumulative count of Article Views (full-text article views including HTML views, PDF and ePub downloads, according to the available data) and Abstracts Views on Vision4Press platform.
Data correspond to usage on the plateform after 2015. The current usage metrics is available 48-96 hours after online publication and is updated daily on week days.
Initial download of the metrics may take a while.