Fig. 4
Download original image
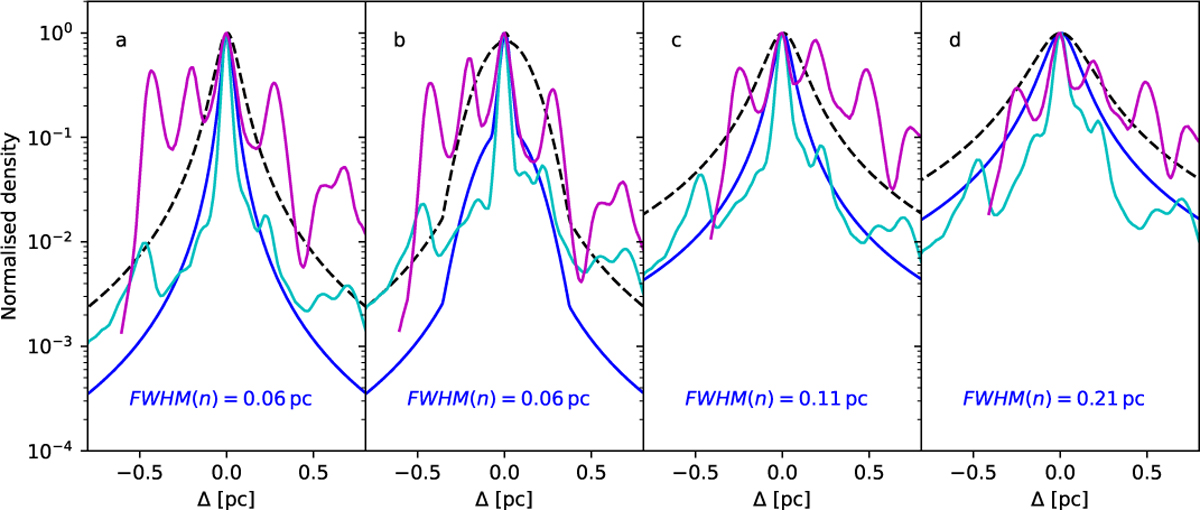
Normalised density profiles (blue lines) for cloud models A-D, for LOS towards filament (position indicated in Fig. 5). Examples of profiles at FWHM distance from the filament spine are plotted with dashed black lines. The density profiles for the other orthogonal directions, along constant right ascension (magenta lines) and constant declination (cyan), are for the model A with THEMIS dust. The quoted FWHM values correspond to the blue curve.
Current usage metrics show cumulative count of Article Views (full-text article views including HTML views, PDF and ePub downloads, according to the available data) and Abstracts Views on Vision4Press platform.
Data correspond to usage on the plateform after 2015. The current usage metrics is available 48-96 hours after online publication and is updated daily on week days.
Initial download of the metrics may take a while.