Fig. 6
Download original image
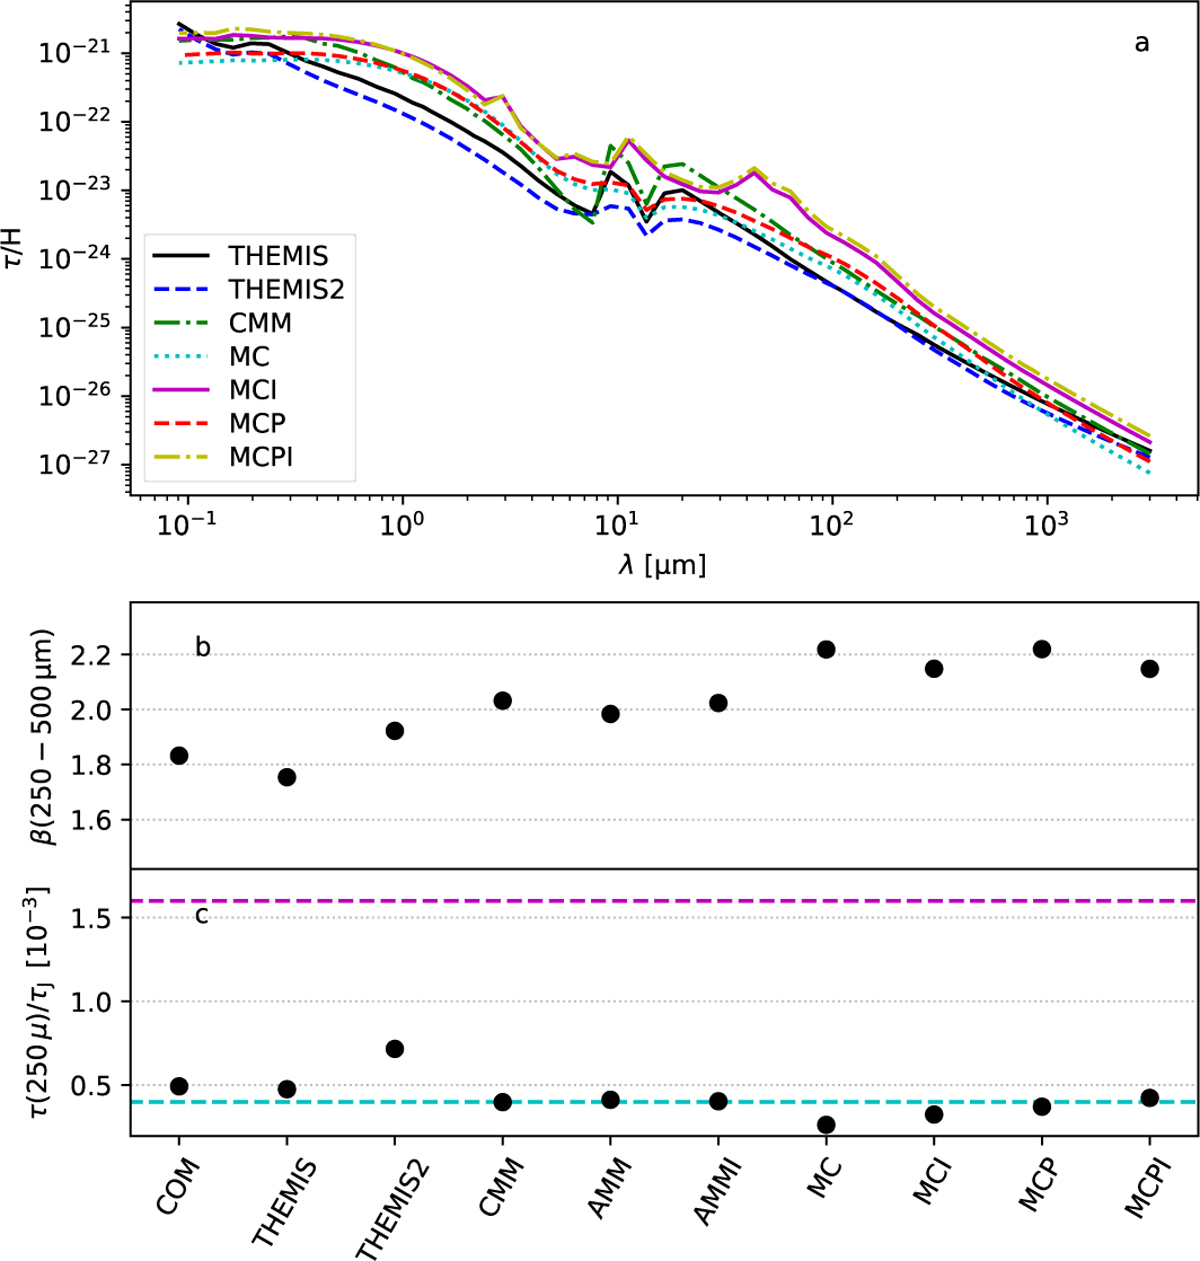
Extinction curves for selected dust models (frame a). Frame b shows the values of the FIR opacity spectral index. Frame c shows the FIR-NIR optical depth ratios τ(250 μm)/τ(J), where the cyan dashed line is drawn at τ(250 μm)/τ(J)=0.4 × 10−3 and the magenta dashed line at τ(250 μm)/τ(J)=1.6 × 10−3. The THEMIS2 models (MC to MCPI) have their default grain size distributions with a0 ∼ 0.05 μm.
Current usage metrics show cumulative count of Article Views (full-text article views including HTML views, PDF and ePub downloads, according to the available data) and Abstracts Views on Vision4Press platform.
Data correspond to usage on the plateform after 2015. The current usage metrics is available 48-96 hours after online publication and is updated daily on week days.
Initial download of the metrics may take a while.