Fig. 8
Download original image
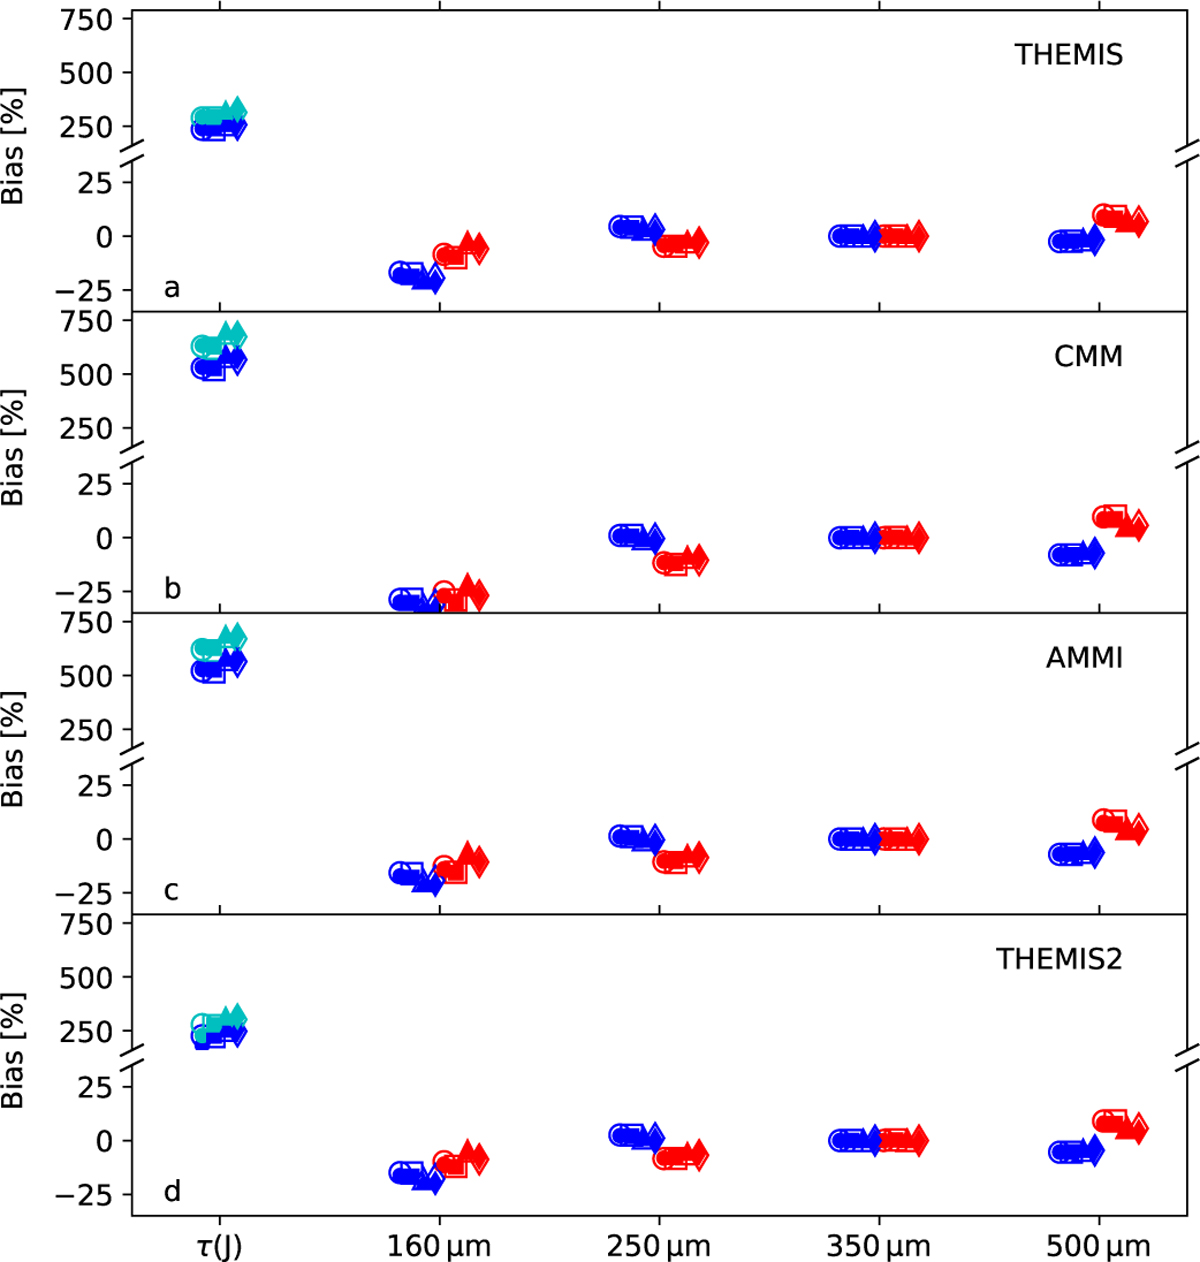
Bias ![]() for four dust models (frames a-d). The symbols correspond to the cloud models A-D (circles, squares, triangles, and diamonds, respectively) that show here only minor differences. The x-axis label τ(J) refers to the filament (Q=1) J-band opacity, where the models are compared to the extinction derived with background stars and the Indebetouw et al. (2005) extinction curve, using either the NICER map (blue symbols) or median value of individual stars over the selected region (cyan symbols). For 160−500 μm the errors are shown for the filament (Q=1, blue symbols) and the ridge (Q=2, red symbols) regions, assuming an external extinction of
for four dust models (frames a-d). The symbols correspond to the cloud models A-D (circles, squares, triangles, and diamonds, respectively) that show here only minor differences. The x-axis label τ(J) refers to the filament (Q=1) J-band opacity, where the models are compared to the extinction derived with background stars and the Indebetouw et al. (2005) extinction curve, using either the NICER map (blue symbols) or median value of individual stars over the selected region (cyan symbols). For 160−500 μm the errors are shown for the filament (Q=1, blue symbols) and the ridge (Q=2, red symbols) regions, assuming an external extinction of ![]() (open symbols) or
(open symbols) or ![]() (filled symbols). The symbols are spread along the x-axis for better readability.
(filled symbols). The symbols are spread along the x-axis for better readability.
Current usage metrics show cumulative count of Article Views (full-text article views including HTML views, PDF and ePub downloads, according to the available data) and Abstracts Views on Vision4Press platform.
Data correspond to usage on the plateform after 2015. The current usage metrics is available 48-96 hours after online publication and is updated daily on week days.
Initial download of the metrics may take a while.