| Issue |
A&A
Volume 706, February 2026
|
|
|---|---|---|
| Article Number | A89 | |
| Number of page(s) | 14 | |
| Section | Extragalactic astronomy | |
| DOI | https://doi.org/10.1051/0004-6361/202555566 | |
| Published online | 03 February 2026 | |
Bar evolution in edge-on galaxies: A demographic study of boxy/peanut bulges
1
Indian Institute of Science Education and Research Bhopal 462066, India
2
Universidad Andrés Bello, Facultad de Ciencias Exactas, Departamento de Física y Astronomía, Instituto de Astrofísica Fernández Concha 700 Las Condes Santiago RM, Chile
3
Indian Institute of Astrophysics Bangalore 560034, India
★ Corresponding authors: This email address is being protected from spambots. You need JavaScript enabled to view it.
; This email address is being protected from spambots. You need JavaScript enabled to view it.
Received:
18
May
2025
Accepted:
17
November
2025
Abstract
Context. Boxy/peanut and X-shaped (BP/X) bulges are prominent features in edge-on disk galaxies and they are believed to represent vertically thickened bars. Despite their relevance in bar evolution, a statistically robust census of these structures in large surveys remains lacking.
Aims. We aim to provide the largest catalog of BP/X structures in edge-on galaxies to date, along with an investigation of their properties and role in shaping galaxy scaling relations.
Methods. We selected a sample of 6684 edge-on galaxies from SDSS DR8 using Galaxy Zoo classifications, requiring a high edge-on probability (> 0.9) and a minimum of ten independent votes. We performed a two-dimensional (2D) image decomposition using GALFIT to obtain the structural parameters. The residual images were visually inspected to classify BP/X features into four categories: strong both-sided, both-sided, one-sided, and control (no BP/X). We also estimated the stellar mass, distance, and physical size for each galaxy.
Results. Out of 6653 classified galaxies, we identified 1673 (∼25%) with both-sided BP/X features, 504 (∼8%) strong, and 1169 (∼17%) weak, as well as 1112 (∼17%) one-sided structures, making up a total of 2785 BP/X-hosting galaxies (∼42%). We find that one-sided structures, likely signatures of ongoing buckling, are more frequent than strong both-sided bulges across all stellar masses. The fraction of BP/X bulges increases with stellar surface mass density, indicating a connection with bar formation in dense discs. We also find that galaxies with strong BP/X bulges contribute to increased scatter in the stellar-mass-size and stellar-mass-surface-density relations, particularly at higher masses.
Key words: galaxies: bulges / galaxies: evolution / galaxies: formation / galaxies: general
© The Authors 2026
 Open Access article, published by EDP Sciences, under the terms of the Creative Commons Attribution License (https://creativecommons.org/licenses/by/4.0), which permits unrestricted use, distribution, and reproduction in any medium, provided the original work is properly cited.
This article is published in open access under the Subscribe to Open model. This email address is being protected from spambots. You need JavaScript enabled to view it. to support open access publication.
1. Introduction
Spiral galaxies with elongated bar-like structures in their center are commonly known as barred galaxies and comprise nearly 30-70% of all spiral galaxies (Aguerri et al. 2009; Masters et al. 2011; Díaz-García et al. 2016). Bars play a major role in the evolution of spiral galaxies (Marchuk et al. 2022). They are thought to funnel a large amount of gas into the nuclear region (Shlosman et al. 1989; Boone et al. 2007), which aids in the formation of new stars in the central and bar regions (Díaz-García et al. 2020; Fraser-McKelvie et al. 2020). The accretion of gas into the nuclear region also feeds the central supermassive black holes (SMBHs) and promotes their growth. At times, excess gas accretion onto the SMBH can ignite the nuclear activity in the galaxy (Alonso et al. 2013; Galloway et al. 2015; Silva-Lima et al. 2022; Garland et al. 2024; Kataria & Vivek 2024).
During the growth phase of bars, the nuclear stellar disk (NSD) is formed as a result of intense star formation in the central sub-kiloparsec (sub-kpc) region (Friedli & Benz 1993; Heller & Shlosman 1994; Friedli & Benz 1995; Martin & Friedli 1997; Wozniak 2007; Kim et al. 2011; Cole et al. 2014; Seo et al. 2019; Baba & Kawata 2020; Sormani et al. 2022). The bar suppresses star formation throughout the remainder of its extent (Martin & Friedli 1997; Spinoso et al. 2016; Khoperskov et al. 2018; Donohoe-Keyes et al. 2019). Therefore, the stars of the NSD are younger than the bar itself (Baba & Kawata 2020). Using numerical simulations, Baba & Kawata (2020) showed that the oldest stellar population in the NSD can be used for dating bar formation time (also see de Sá-Freitas et al. 2023).
Bars drive the secular evolution of spiral galaxies by redistributing matter and angular momentum (Athanassoula 2003; Minchev et al. 2011). Despite numerous studies on bar formation and evolution, their origin remains a topic of debate (see Sellwood 2014, for a review). The bar formation mechanisms involve global unstable modes of a rotating disk (Kalnajs 1972; Ostriker & Peebles 1973), swing amplification of leading small perturbations (Toomre 1981), slow trapping of stellar orbits due to a weak non-axisymmetric perturbation (Lynden-Bell 1979), mutual gravitational interaction of precessing orbits (Polyachenko & Polyachenko 2003), and tidal interactions between galaxies (Miwa & Noguchi 1998; Lang et al. 2014; Łokas 2018).
Studies suggest that disk evolution of the galaxy also includes the development of bars in length and thickness (Athanassoula 2003, 2005). The vertical thickening of bars in galaxies is mainly studied using numerical simulations (Combes et al. 1990; Raha et al. 1991; Bureau & Athanassoula 2005; Martinez-Valpuesta et al. 2006; Kumar et al. 2021, 2022; Kumar 2023; Ghosh et al. 2024). Among all bar thickening mechanisms, bar buckling is the most violent, whereby the galactic bar bends out of the galactic plane (Combes et al. 1990; Raha et al. 1991; Łokas 2019; Kumar et al. 2022). Buckling instability involves spontaneous symmetry breaking with respect to the galactic equatorial plane (Pfenniger & Friedli 1991; Raha et al. 1991), resulting in the thickening and weakening of bar over dynamical timescales. Observations of some galaxies having a boxy/peanut (B/P) bulge shows the presence of a bar at their center, suggesting that a B/P bulge is a byproduct of galactic bar formation (Bettoni & Galletta 1994; Kuijken & Merrifield 1995; Veilleux et al. 1999).
Alternative mechanisms proposed to explain the development of BP/X-shaped (BP/X) bulges include vertical resonant heating (Combes et al. 1990; Pfenniger & Friedli 1991; Quillen et al. 2014) or resonant trapping within a vILR (vertical inner Lindblad resonance) during the secular evolution of bars (Quillen 2002; Sellwood & Gerhard 2020). Recently, Zozulia et al. (2024a,b, 2025) investigated bar formation and thickening through the analysis of action variables and resonant angles of stellar orbits. Their results demonstrate that vertical trapping plays a dominant role in shaping the B/P morphology of galactic bars. Recent N-body simulations (Smirnov & Sotnikova 2018; Sellwood & Gerhard 2020) have illustrated that these mechanisms can encompass BP/X bulges without immediate bar buckling following bar formation.
We observe the formation of BP/X bulges across a wide range of numerical simulations (e.g., Friedli et al. 1990; Raha et al. 1991; Merritt & Sellwood 1994; Debattista et al. 2006; Martinez-Valpuesta et al. 2006; Saha et al. 2013; Fragkoudi et al. 2017; Debattista 2018; Smirnov & Sotnikova 2018; Di Matteo et al. 2019; Khoperskov et al. 2019; Łokas 2019; Smirnov & Sotnikova 2019; Collier 2020; Debattista et al. 2020; Kumar et al. 2022). Prior to bar formation, galaxies typically exhibit vertical symmetry. However, three-dimensional (3D) models of bar-unstable discs reveal that newly formed bars can bend out of the disk plane, losing coherence and inducing random vertical motions (Raha et al. 1991). This leads to a bar that is significantly thicker than the surrounding disk and appears B/P when viewed edge-on (Combes & Sanders 1981; Combes et al. 1990). Such bulges are now widely interpreted as edge-on bars. The vertical asymmetry arises after the bar formation and grows rapidly indicating a clear peak followed by rapid decreases within a few gigayears (Athanassoula & Martinez-Valpuesta 2008; Łokas 2019). Recently, Erwin & Debattista (2016), Li et al. (2017), Xiang et al. (2021) reported evidence of buckling instability in total eight observed galaxies, providing support for buckling driven BP/X bulges.
There have been a few attempts to study the set of galaxies having BP/X bulges (Ciambur & Graham 2016; Laurikainen & Salo 2016; Savchenko et al. 2017). However, it is not easy to detect the presence of a BP/X bulge, as it requires the bulge to be oriented in a perpendicular direction with respect to our line of sight. There has been an attempt to create a catalog of edge-on galaxies (Kautsch et al. 2006). Additionally, there have been attempts to study the relationship between the development of BP/X bulges and the dark matter halo using numerical simulations (Kumar et al. 2022). Several previous studies (discussed in Section 7) have shown a strong correlation between stellar mass and the presence of BP/X bulges. These studies have been conducted with smaller sample sizes than ours and have concluded that high-mass galaxies are more likely to show the presence of a BP/X bulge than lower-mass galaxies. The gas mass fraction could play a role in determining the way in which the bar develops, either via buckling or symmetric growth, as suggested by Berentzen et al. (2007). However, the current gas mass fraction does not appear to influence whether a BP/X bulge will form (Erwin & Debattista 2017).
Here, we aim to separate the edge-on galaxies having BP/X bulge from a large sample of edge-on galaxies obtained from the Sloan Digital Sky Survey. We classified galaxies having BP/X bulges and studied different parameters such as the masses and sizes of galaxies with or without BP/X bulges. Then we compared their properties to find any specialty in the sample with BP/X bulges. We verified some of the past similar analysis performed previously on a smaller sample size. Furthermore, we investigated the effect of BP/X hosting galaxies on scaling laws and the mass-size relation.
2. Sample selection
2.1. The database
As the first step of our study, our aim was to compile a set of edge-on galaxies as BP/X bulges are only identifiable in edge-on projection when the bar is nearly side-on to our line of sight. For this purpose, we obtained the ZooSpec table from the Galaxy Zoo 1 project (Lintott et al. 2008, 2010) available with SDSS data. The Galaxy Zoo is a citizen science program where volunteer citizens help astronomers identify several unique morphological features (e.g., bars, spiral arms, bulge, rings etc.) by voting on an interactive web interface. The ZooSpec table provides the voting data, which we used to select the set of edge-on galaxies for our analysis. The two criteria we imposed to select the desired galaxies as listed below:
-
(i)
Number of votes (nvote) > 10;
-
(ii)
Fraction of votes for edge-on galaxy (p_edge) > 0.9.
The main motivation for choosing a minimum of ten votes for each galaxy is to avoid an uncertain classification due to small number of voting. A fraction greater than 0.9 generally signifies that the most volunteers have identified the galaxy as edge-on. Afterward, we obtained the coordinates (RA, Dec) of the selected galaxies from the “Galaxy” table of the Sloan Digital Sky Survey data release 8 (SDSS DR8)1. The “Galaxy” table contains photometric data of all the objects classified as galaxies from the “PhotoPrimary” table. Although SDSS DR17 was available, we used DR8 because ZooSpec table builds on the DR7 and its link is available with DR8 (Aihara et al. 2011). These conditions returned a set of 9068 edge-on galaxies. The SQL search query for this task is given below:
SELECT
g.ra, g.dec, g.sky_r, g.petroRad_r,
g.sky_r, g.expPhi_r
FROM
Galaxy g
JOIN zooSpec z ON z.objid = g.objID
WHERE
z.nvote > 10 AND
z.p_edge > 0.90
2.2. FITS image files
Next, we used the coordinates (RA, Dec) of the egde-on galaxies to download the r-band images in Flexible Image Transport System (FITS) format. Our choice of r-band images reflects our interest in the stellar light profile of galaxies because the r band is less affected by dust extinction and has higher S/N ratio (York et al. 2000), which makes it easier to distinguish other structures from the oval (Yoshino & Yamauchi 2015). For this purpose, we utilized the SDSS module2 of the Astroquery (Ginsburg et al. 2019) Python package. Astroquery provide a set of tools for accessing astronomical data from the webs of various surveys. To obtain the complete image of the galaxy, we use the radius of the field to be 1.5 times the Petrosian radius of the galaxy. The pre-computed Petrosian radii of the galaxies are obtained using SDSS SQL search query along with the RA, Dec positions as discussed in Section 2.1. For all the galaxies, we used the default SDSS pixel scale (i.e., 0.396 arcsec/pixel). Out of 9068 galaxies, we can obtain images for 6684 galaxies because SDSS does not return images for some specific positions. Through a quick visual inspection we removed incomplete images (where only some part of the galaxy is visible) leaving a sample of 6653 galaxies for further analysis. For all the galaxies in our sample, we downloaded the corresponding PSF file from SDSS Science Archive Server.
2.3. Other relevant parameters
Along with obtaining the FITS images of the edge-on galaxies, we also compiled some relevant parameters, which we used later in the study. These parameters include: the object ID (objid), redshift (z), and absolute magnitudes. For this purpose, we made use of the RA, Dec positions of selected galaxies in SDSS crossID tool3. This tool allows users to upload their own table which can be joined with different SDSS tables to extract other information using a similar SQL query as described in Section 2.1. We extracted the object ID (objid), absolute magnitudes in the g, r, and u band from the Photoz table, along with the redshift (z) from the SpecObjAll table. We also obtained exponential fitting parameters, such as the minor-to-major-axis ratio (b/a), effective radius (Re), position angle, and magnitude from the PhotoObjAll table.
3. FITS images processing
As outlined in the introduction, this work is focused on the characteristics of BP/X bulges and their host galaxies. Thus, we tried some well-known methods (e.g., median filtering, ellipse fitting, profile fitting, etc.) to identify the BP/X structures in our sample. In this section, we discuss the methods we applied, their drawbacks, and the method we ultimately adopted for further analysis.
3.1. Median/Gaussian filter
Using the median or Gaussian filter to smooth the image, we then subtracted these smoothed image from original image (and sometimes adding a factor of the residual image back into the original image) to sharpen the hidden BP/X structure. This approach has been detailed in the literature (Faúndez-Abans & de Oliveira-Abans 1998). We first started by using the median filter available in the Scipy Python package4 (Virtanen et al. 2020a) to identify the BP/X hosting galaxies. The median filter was used to smooth out any image according to input box (or window) size. We give galaxy image and the box size as input parameters. The value of each pixel in the output image is calculated as the median value of the pixels inside the box of the given size around that pixel. Then we subtract the median filtered image from the original image to get the residual image. The residual image shows the salient features hidden near the central part of the galaxy as the outer regions mostly remain the same in both images and get canceled out in the residual image.
We tested this method on some images and found that the clarity of the structure in the residual image varies with the box size used for smoothing. For each image, we needed to find a suitable box size by trial and error method. We could not find any specific box size that would work for all images. This method does provide a work-around when we want to search BP/X structures in a few images. Otherwise, it is way difficult to manually identify a correct box size for individual image given large sample, such as the one we have in this study. Therefore, we did not use a median-Gaussian filter in our analysis.
3.2. Ellipse fitting
The subtraction of smooth intensity distribution of galaxy from its observed intensity distribution can also sharpen the hidden BP/X structure. Therefore, we constructed a smooth intensity distribution for the galaxy by fitting iso-intensity ellipses using a Python package Photutils5 (Bradley & Developers 2022). It requires an initial guess for an ellipse geometry to start the fitting. The initial ellipse can be described by the user, with guesses for the center, semi-major axis, ellipticity, and position angle. We guessed the initial parameters to perform ellipse fitting and use the fitted ellipses to model the smooth intensity profile of the galaxy. Then we subtracted this model image from observed image to find the residual image. This residual images show the hidden structures behind the smooth intensity distribution of galaxy.
To automate this process for our large sample, we wrote a Python script to calculate the center of mass and performed a Fourier decomposition of each image. The center of mass is set as the center of the ellipse, with a phase angle of m = 2, while the Fourier mode sets the position angle, along with the radius where m = 2 Fourier mode reaches maximum, set as the semi-major axis. For the ellipticity (ϵ), we used a minor-to-major-axis ratio (b/a) obtained from the Galaxy table of SDSS data (i.e. ϵ = 1 − b/a). We note that we would have used initial guesses (e.g., on the position angle and radius) from an exponential fitting obtained from SDSS data for ellipse fitting (Stoughton et al. 2002). However, we performed a Fourier analysis to minimize the failure of automatic fitting process because SDSS parameters are very different for some galaxies (e.g., SDSS edge-on galaxies that do not appear to be edge-on). This method works quite well as compare to median-Gaussian filter method for large sample. However, it often fails in terms of a fitting when there is some discontinuity in the image or the guessed parameters are somewhat different (e.g., due to the presence of another galaxy, a bright foreground star, dust lane, etc.).
3.3. GALFIT profile fitting
Another widely used method to enhance the visibility of hidden structures is to subtract a smooth model intensity distribution from observed intensity distribution (Yoshino & Yamauchi 2015; Ness & Lang 2016). Since most of the disk galaxies follow exponential intensity distribution, we can model exponential intensity distribution using exponential fitting parameters obtained from SDSS data. However, as mentioned in Section 3.2, not all the edge-on SDSS galaxies display an edge-on intensity distribution. Also, a radial exponential profile used in SDSS pipeline (Stoughton et al. 2002) cannot completely describe disk profile (van der Kruit & Freeman 2011). Therefore, we did not directly use the SDSS exponential fitting parameters. Instead, we performed a 2D fitting using the edge-on disk profile available in GALFIT 2D image decomposition tool (Peng et al. 2010). The edge-on disk profile is expressed in terms of scale radius (Rs) and scale height (Z0) and (Van der Kruit & Searle 1981) expressed as
 (1)
(1)
where Σ0 is the central surface brightness and K1 is a Bessel function.
GALFIT is a standalone 2D image decomposition program written in C language. It uses an arbitrary number and mix of parametric functions (e.g., Sersic, Nuker, Gaussian, Moffat, and exponential) to decompose the image. It creates the model image and iterates it over and over the original image to find the perfect fit. It is capable of fitting galaxies and the sub-structures in them. Although the presence of dust significantly affects photometric decomposition in edge-on galaxies, its impact must be carefully considered. Using radiative transfer modeling of simulated galaxies, Savchenko et al. (2023) showed that dust can lead to a 25–50% increase in the fitted disk scale radius in edge-on systems. In contrast, we expect bar formation to enhance central brightness, which typically results in a reduced disk scale radius in single component fitting; whereas a bar thickening is expected to produce counter effect similar to presence of the dust. A detailed investigation of the counterbalancing effects of dust and bar presence is beyond the scope of this paper. In the case of extensive data as we have in this study, automation is very essential. For automation, the user needs to provide an external “wrapping” algorithm to take care of the preprocessing and postprocessing of the fittings. For our image processing, we prepared an input file containing all the input parameters (initial guesses) to start the computation. We discuss these initial guesses below.
3.4. Initial guesses
To initialize the fitting process in GALFIT, we need to provide initial guesses for central surface brightness, scale radius and scale height in Eq. (1) along with the center and position angles. We obtained the initial guesses for the center, position angle, and scale radius using a center of mass and Fourier analysis, as discussed in Section 3.2. Given the sample of edge-on disk galaxies, the initial guess for scale height is assumed to be 0.2 × scale radius. If the fitting failed, we tried again with larger scale height of 0.5 × scale radius, particularly when galaxies did not appear edge-on. Since GALFIT performs edge-on disk surface brightness fit in mag/arcsec2. To guess the central surface brightness, we considered a square of 10 pixels × 10 pixels size around the center of galaxy and measured the total counts in this box as ADUs. Then, we measured the central surface brightness in mag/arcsec2 using following expression,
 (2)
(2)
where Δx and Δy are the side lengths of the region in x and y direction, respectively, taken as 10 pixels in each directions. The time, texp, is the exposure time, which is taken to be 53.9 seconds for the r band. The magnitude, magzpt, is the zero-point magnitude, taken here as 24.8 (see Table 21 of Stoughton et al. 2002).
For each galaxy, all these initial guess parameters were compiled into a text file in GALFIT input format. It also included the galaxy name, output file name, and convolution box size, among other parameters. Our wrapping algorithm for automation takes care of the variable parameters (e.g., initial guesses, galaxy name, output file name, etc.). This fitting analysis provided us with edge-disk parameters which were not available in the original SDSS catalog. In Fig. 1, we show comparison of exponential disk parameters obtained from SDSS and edge-disk parameters from our GALFIT decomposition. The left panel compares the position angles and the middle panel compares the scale radii. Our analysis shows a good agreement between SDSS and GALFIT position angles and scale radii as evident from the equality line displayed in the left-most and middle panels. The SDSS exponential fitting semi-minor to semi-major axis ratio (b/a) and GALFIT edge-disk fitting scale height to scale radius ratio (Z0/Rs) exhibits a linear relation, but a non-unity slope, as shown in the right most panel. We fit the straight line and obtained the following relation,
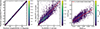 |
Fig. 1. Comparison of the fitted position angle, radius, and axial ratio between the edge-on disk profile fitting by GALFIT and exponential disk profile fit parameters in SDSS. The red line in left most and middle panel gives the line corresponding to y = x. In the rightmost panel, the fitting line is given in red with the fitting parameters. Finally, Z0 is the disk height and Rs denotes the scale radius obtained from GALFIT. |
 (3)
(3)
4. BP/X bulge classification
After edge-disk fitting using GALFIT, we visually inspected the residual images (=original image − model image) of all 6653 galaxies to build a catalog of galaxies with and without BP/X bulges for detailed study. The sample without BP/X bulges was considered as the control sample for comparison with the sample with BP/X bulges. We identified BP/X bulges in different stages and contrast. Following is our classification scheme for BP/X bulges and control sample.
-
Both-sided: This class of galaxies show the presence of boxy, peanut, or x-shape structure at their center in the residual images. The structure can be clearly visible as in Fig. 2a,b,c or can be faintly visible as in Fig. 2d,e,f. We identified 1673 galaxies in this class, which comprise nearly 25% of the total sample. On the basis of visibility, this class can be further divided into strong and weak both-sided structures. In our analysis, we refer to both-sided as the collection of both strong and weak both-sided structures, unless specified otherwise.
-
Strong both-sided: From the class of both-sided BP/X bulge galaxies, we separated galaxies showing a clear X-shaped structures and classified them into a strong both-sided sample. These galaxies exhibit a very prominent X-shaped structure, as seen in Fig. 2a,b,c. There are 504 galaxies (nearly 8%) in this class.
-
One-sided: The residual images of these galaxies shows excess intensity on one side of the galactic mid-plane. It appears as if the bulge is present on only one side of the galaxy. Figure 2g,h,i is an example of the galaxy in this sample. One of the possible reason for this appearance is the dust obscuration on one side. Additionally, it is also possible that this class potentially contains galaxies in the initial buckling phase. There are 1112 galaxies in this class, which is nearly 17% of the total sample.
-
Control: These galaxies show no sign of BP/X bulge formation. Therefore, the model completely fits the original image, leaving no feature in the residual. There are a total of 3868 galaxies in this class. Some of the galaxies in the control sample show presence of other significantly bright structure in the projection; for instance, in the bottom-left panel of Fig. 2j,k,l. There are 146 galaxies exhibiting bright structures nearby (i.e., likely neighbor galaxies). The remaining 3722 galaxies do not show any neighboring bright objects in the projection. Thus, nearly 58% of our sample belongs to this class. We note that some of the galaxies showing showing spheroidal structures (classical bulge or end-on projected bars) are also included in the control sample.
For more examples of different categories of BP/X bulges discussed here, we refer to Figs. A.1, A.2, and A.3 in Appendix A. We note that the weak both-sided and one-sided structures may contain some oblate classical bulge structures, which are difficult to distinguish due to spatial resolution limit of the SDSS. We advise considering this caveat when interpreting results for these two classes of BP/X structures in this study.
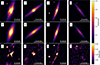 |
Fig. 2. Four galaxies included in our sample, shown in the first row. The model fitted using GALFIT for the corresponding galaxy above it is in the second row. The third row gives the residual image of the corresponding galaxy above it. Each column of figures gives an example of galaxies classified as strong both-sided, weak both-sided, one-sided, and control, respectively, from left to right. The white scale bar marks the scale of 10 arcsec. |
5. Derived quantities for galaxies
Along with the parameters obtained from SDSS catalog and measured using a 2D image decomposition using GALFIT, we derived the stellar masses, distances, and physical sizes of the galaxies from existing information. The following subsections describe our methodology for measuring these derived properties of galaxies.
5.1. Stellar masses
To proceed with the stellar mass estimation, we required a mass-to-light ratio relation. For this purpose, we used a widely adopted stellar mass-to-light ratio relation available for SDSS filters,
 (4)
(4)
where γj is the mass-to-light ratio of the galaxy in jth imaging band. Parameters aj and bj are two constants for the same band at a given color index (here, g − r). We obtained these constants from Bell et al. (2003), Du & McGaugh (2020). Both, Bell et al. (2003) and Du & McGaugh (2020) reported similar a and b parameters for the g − r color. Therefore, we considered using g- and r-band magnitudes for the stellar mass estimation of our sample galaxies (Kumar & Kataria 2022). We obtained the galactic extinction-corrected r- and g-band magnitude from SDSS PhotoObjAll table. The internal extinction in r-band is calculated using the relation Ar = γr log10(a/b), where γr = 1.37 was obtained from Shao et al. (2007). Using the relation  (see Table 2 of Yuan et al. 2013), we measured the internal extinction in the g band. Then, the internal extinction-corrected color and magnitude are given as

We used the extinction corrected absolute magnitudes and colors for mass calculation.
After calculating mass-to-light ratio using above described method, we used the absolute r-band magnitudes (Mr) to measure the luminosities of galaxies in solar unit by following expression.
 (5)
(5)
where, M⊙ is the solar magnitude in the r band. For our analysis, we obtained the solar magnitude from Blanton et al. (2003). Next, we measured the stellar mass of the galaxies in solar mass unit by multiplying mass-to-light ratio with their luminosities following
 (6)
(6)
5.2. Angular distances and physical sizes
We use the spectroscopic redshifts of galaxies obtained from SDSS database to measure their angular distances. In the flat Universe, the angular distance of an object at redshift z is given by (Simard et al. 2011):
 (7)
(7)
where c is the speed of light in vacuum, H0 is the Hubble’s constant, Ωm is the matter density of the universe, and ΩΛ is the dark energy density. For this study, we considered H0 = 70 km s−1 pc−1, Ωm = 0.3, and ΩΛ = 0.7. The peculiar velocities of nearby galaxies affect the redshift measurement, and, thus, their distance using the expression above. Nonetheless, all the galaxy in our sample have z > 0.005, indicating a marginal effect of the peculiar velocities on the distance estimation (Shen et al. 2003).
From the GALFIT photometric decomposition, we obtained the disk scale height and disk scale radius in pixels. Using the default SDSS pixel size of 0.396 arcsec/pixel, we calculated the angular size of galaxies in radian. Then, we obtained the physical sizes of galaxies by multiplying the angular sizes and angular distances.
6. Sample characteristics
As mentioned in Section 2.2, we started with 6684 edge-on galaxies, and performed a 2D morphological decomposition using GALFIT. Furthermore, we visually separated these objects into four different subclasses depending on their central features, as discussed in Section 4. In Fig. 3, we show the distributions of magnitudes, redshifts, scale radii, and stellar masses of our complete sample. The median values of the distributions are represented with the red color vertical lines at the bottom axes of respective panels. The lower and upper limits of dark distributions respectively indicates 16% and 84% range as shown in the legends of respective panels.
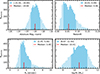 |
Fig. 3. Absolute r-band magnitude, redshift, angular scale radius, and mass distribution of galaxies in our base sample. The red vertical lines correspond to median values, and the dark shaded regions show the 16th to 84th percentiles range of the distributions. |
Top left panel of Fig. 3 shows the absolute magnitude distribution of the sample galaxies. Our sample cover an absolute r-band magnitude from −16 to −26. The median of magnitude distribution lies at −19.8 with 1σ percentile range from −18.6 to −21.0. As most of the galaxies are bright and resolved, they are primarily local volume objects. The median redshift of the sample is 0.06 with 1σ percentile range from 0.03 to 0.09 as can be seen from top right panel of the figure. The farthest galaxy in the sample lies at redshift 0.2.
The bottom left panel of Fig. 3 displays the disk scale radius of galaxies. The median angular scale radius of the sample is 3.4 arcsec with 16 − 84% range 2.4 − 5.0 arcsec in r-band. A few nearby galaxies show larger angular size greater than 10 arcsec. For clarity, we have shown the distribution up to 10 arcsec. Our derived stellar masses of the galaxies span a wide range from 2 × 10⁸ to 5 × 10¹² M⊙. The median stellar mass of the sample is 2.5 × 10¹⁰ M⊙ and the 1σ percentile range covers 4.6 × 10⁹ to 1.2 × 10¹¹ M⊙ (see the bottom-right panel of Fig. 3).
Since the identification of BP/X structures is affected by the inclinations of galaxies, it is worth discussing the inclination distribution of our sample. We measured the inclination angle using the axis ratio, b/a, obtained from SDSS data, applying the relation  (Holmberg 1958), where q is the intrinsic axial ratio. Following Tully & Fisher (1977), we adopted q = 0.2 for this analysis. We found a median inclination of ≈87 degree, with a 16–84% range of 79–90 degrees. For an ideally edge-on galaxy, the inclination angle is 90 degree, indicating that our sample largely consists of nearly edge-on galaxies.
7. Result
7.1. Mass and size distributions of BP/X bulges
First, we investigated the differences in properties such as mass, disk radius, disk height, and axial ratio among the different classes we identified in the whole sample. In Fig. 4, we plot the distributions of mass, axis ratio, disk height, and disk radius for the four samples in this study. The control, both-sided, one-sided, and strong both-sided are respectively shown with blue, green, red, and purple colors. To better understand the distribution, we fitted each dataset using the “log normal” distribution. For the fitting, we used the Python package Scipy.
The distribution of masses (Figure 4a) shows that the mass distribution for the sample without any signature of bulge formation (control sample) peaks at log(M*/M⊙)≈10.1. However, for the other three samples (i.e., the ones showing signatures of bulge formation peaks in the range of log(M*/M⊙) > 10.5). This is expected because bulge formation occurs in galaxies with a bar and high-mass galaxies are more likely to host bars than lower mass galaxies (Erwin 2018).
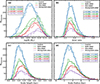 |
Fig. 4. Distribution of different parameters along with the “log norm” fitting parameters for the distributions of mass, axial ratio, scale height, and radius for different samples classified according to the presence (or absence) of a BP/X bulge. |
We defined the axial ratio as the ratio of disk scale height to disk scale radius. For galaxies with a signature of bulge formation, we expect the axial ratio to be higher than that of the control sample, as bars thicken during BP/X bulge formation. From our “lognorm fit”, we obtained the mean value of axial ratio of strong both-sided galaxies higher among all samples (Fig. 4b), although they are not significantly different. This similarity in the axial ratio is also evident from the scale height (Fig. 4c) and scale radius distributions (Fig. 4d).
For the further analysis described in Sections 7.4 and 7.5, we used only the galaxies having stellar mass, disk radius, and disk height less than 5 × 10¹¹ M⊙, 14 kpc, and 5 kpc, respectively. By using these limits, we removed the higher value outliers in the data. These limits do not affect the correctness of the analysis because the sample includes nearly 98.3% of galaxies. Category-wise, we have nearly 99% of control sample and one-sided sample, nearly 97.4% of both-sided, and 95.4% of strong both-sided within this limit.
7.2. BP/X fraction
There have been a number of attempts to estimate the BP/X bulge fraction for different-size samples of edge-on galaxies. The earliest study was by Jarvis (1986), who estimated BP/X frequency of 1.2% in his relatively small sample of 41 disk galaxies. In a sample of 117 visually edge-on galaxies with diameter D25 ≥ 3.5′, Shaw (1987) estimated that approximately 20% contain a BP/X bulge. This author noted this as a conservative lower limit, as additional BP/X bulge galaxies were identified that did not appear in the primary masking. Using a larger sample of 555 galaxies with axial ratio < 0.5, De Souza & Dos Anjos (1987) estimated the BP/X bulge fraction to be 13%.
Lütticke et al. (2000) presented the first detailed statistics of BP/X bulges using a large sample of ∼1350 edge-on galaxies from Third Reference Catalog of Bright Galaxies (RC3: de Vaucouleurs et al. 1991). They found 45% BP/X bulges in their sample of 734 classifiable bulges. Yoshino & Yamauchi (2015) decomposed about 1700 SDSS DR7 disk galaxies, and identified BP/X structure. In their clean sample of 1329 galaxies in i-band, they reported 22% BP/X structures. Since Yoshino & Yamauchi (2015) used SDSS sample, we cross-matched our sample with the their catalog of 1312 edge-on galaxies in the r band, and identified 455 galaxies in common. The primary reason for the discrepancy in sample sizes lies in the differing selection criteria.Yoshino & Yamauchi (2015) selected galaxies with a minor-to-major isophotal axis ratio in the r band less than 0.25, whereas our sample was selected based on volunteer votes. When we compare the b/a values from their model fitting for both the common and complete samples, we find that the common sample predominantly consists of galaxies with b/a < 0.2; meanwhile, a complete sample shows a median b/a ≈ 0.2, indicating that a large fraction of their sample comprises moderately inclined systems. Nonetheless, out of these common galaxies they identified 129 total BP/X structures (7 strong, 42 standard, and 80 weak in their definitions) and we identified 165 total BP/X structures (68 strong both-sided and 97 both-sided). Recently, a similar fraction of BP/X bulges is reported in r-band images. Marchuk et al. (2022) trained an artificial neural network (ANN) to automatically identify BP/X structures in large sample of 13048 edge-on galaxies obtained from DESI Legacy Imaging Survey (Dey et al. 2019). They found about 1925 (∼15%) galaxies with BP/X structures.
As described previously in Section 4, we started with 6653 edge-on galaxies and classified them into three classes of BP/X bulges: both-sided, strong both-sided, and one-sided. We identified 1673 (∼25%) both-sided bulges, and 1112 (∼17%) one-sided bulges. Among both-sided bulges 504 (∼8%) are strong both-sided with prominent X-structure, and remaining 1169 (∼17%) show faint X-structure. When combined together, both-sided and one-sided make ∼42% (2785 galaxies) of the total sample. Although our base sample is nearly half as large as that studied in Marchuk et al. (2022), we visually verified the presence of BP/X structure in each galaxy by manually varying intensity of the residual images to avoid missing any faint structure. Therefore, our analysis presents largest and complete sample of BP/X structures till date with detailed classification.
7.3. Relationship of BP/X bulge with the stellar mass
The fraction of barred galaxies shows a strong correlation with the stellar mass of a galaxy (Nair & Abraham 2010; Melvin et al. 2014; Cervantes Sodi 2017). Generally, massive galaxies tend to have bar more likely. Analogously, by considering a sample of 84 barred galaxies, Erwin & Debattista (2017) showed that the BP/X bulges are more common in galaxies with higher stellar masses. They found about 80% of barred galaxies with stellar masses > 1010.4 M⊙ have BP/X bulges. They concluded that the frequency of BP/X bulge in barred galaxies is nearly 50% in the stellar mass range log(M*/M⊙)≈10.3 − 10.4. The similar stellar mass-dependence of BP/X bulges has been reported in other studies (Marchuk et al. 2022), and at higher redshift as well (Kruk et al. 2019).
In Fig. 4a, we plot the stellar mass distribution of both-sided (green), strong both-sided (purple), one-sided (red), and control sample (blue) in this study. We found that the distribution of control galaxies peaks at lower stellar mass than the galaxies with BP/X bulges. The median of the control sample lies at log(M*/M⊙) = 10.14, whereas the sample with both-sided, strong both-sided, and one-sided BP/X bulges have median at log(M∗/M⊙) = 10.46, 10.75 and 10.55, respectively. Our results are consistent with the previous findings of Erwin & Debattista (2017), Kruk et al. (2019), Marchuk et al. (2022), suggesting massive galaxies most likely host the BP/X bulges.
Furthermore, we measured the BP/X fraction in our sample of edge-on galaxies. In Fig. 5, we show the fraction of both-sided (green), strong both-sided (purple), one-sided (red) bulges with the stellar mass of galaxies. The vertical bars in respective curve represent the statistical uncertainty in the measurement, defined as  , where f is the fraction of a bulge class at any stellar mass bin and N being total number of galaxies in that bin. Similarly to previous studies, we noticed an increasing BP/X bulge fraction with an increasing stellar mass of galaxies. In the stellar mass range shown here, the fraction of one-sided BP/X bulges is always higher than the strong both-sided bulges at any given stellar mass. Additionally, the fraction of both-sided BP/X bulges, which also includes strong both-sided bulges, is always the highest for any stellar mass. In the shown stellar mass range, we can see an increase in strong both-sided, one-sided and both-sided bulge fraction, respectively, from 0, 0, and 20 to 18, 26, and 42 per cent.
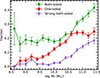 |
Fig. 5. Fraction of galaxies hosting both-sided (green), one-sided (red) and strong both-sided (purple) BP/X structures as a function of their stellar mass. Fraction of BP/X hosting galaxies is seen to increase with their stellar mass. |
7.4. Dependence of BP/X bulge on stellar surface density
To investigate the dependence of BP/X structures formation on the disk stellar surface density, we measured the average stellar surface density of galaxies in our sample. We considered that the total stellar mass of a galaxy lies within its Petrosian radius and define average stellar surface density as  . We note that we considered a Petrosian radius for measuring the average stellar density (instead of the scale radius) because the measurement of the scale radius is significantly affected by the secular evolution of inner disk and presence of dust, as mentioned in Section 3.3 (see Appendix B for similar analysis using scale radius). In Fig. 6, we compare the fraction of both-sided, one-sided, and strong both-sided BP/X structures as a function of average stellar surface density of galaxies, respectively, in green, red, and purple colors.
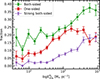 |
Fig. 6. Fraction of both-sided (green), one-sided (red), and strong both-sided (purple) BP/X structures as a function of average surface density of galaxies. The high-surface-density discs tend to host more BP/X structures than the low-surface density discs. |
Figure 6 clearly shows that the fraction of any type of BP/X structure increases with the increasing average surface density of galaxies. The low-surface-density discs (ΣavgRp ≲ 20 M⊙ Pc) show a nearly constant fraction of both-sided and strong both-sided BP/X bulges. Below this surface density limit, the fraction of strong both-sided structures is less than 3%, while both-sided makes about 15 − 20%, and the contribution of one-side structures is about 6 − 8%. For high-surface-density discs (ΣavgRp ≳ 20 M⊙ Pc), the fraction of BP/X structure hosting discs rises by about 15 − 20% across all three groups. This analysis shows that the high-surface-density discs are more likely to host BP/X structures, as compared to low-surface-density discs.
The increasing fraction of BP/X structures with increasing average surface density of galaxy provides an additional constraint on the BP/X bulge formation. Although the fraction of BP/X structures strongly depends on the stellar mass of galaxies, this study suggests the domination of BP/X structures in high-surface-density discs. It is consistent with the bar formation criterion that the high-surface-density disk have a low Toomre-Q parameter, which makes the disk with respect to the dynamical instability. An unstable dynamically cold disk can form a bar easily, which can eventually thicken to form a BP/X structure (Combes & Sanders 1981; Raha et al. 1991; Athanassoula 2005).
7.5. Effect of BP/X structure on galaxy evolution
7.5.1. The mass-radius relation
The mass-radius relation of galaxies is a fundamental scaling law that links a galaxy’s stellar mass to its physical size. This relation shows that more massive galaxies tends to be larger in size. However, the slope and scatter of the relation depend on galaxy type. Early-type galaxies (ellipticals and lenticulars) typically exhibit a steeper mass–radius relation, indicating more compact structures at fixed mass compared to late-type (disk-dominated) galaxies (Shen et al. 2003; van der Wel et al. 2014). At a given stellar mass, early-type galaxies are smaller than late-type galaxies, reflecting differing formation mechanisms; such as gas-poor mergers for ellipticals and inside-out star formation for discs (Naab et al. 2009; Nelson et al. 2016). Moreover, high-redshift galaxies (z ≳ 2) are observed to be significantly more compact at fixed stellar mass than their local counterparts, suggesting substantial size growth over cosmic time (Trujillo et al. 2006; van Dokkum et al. 2010). Understanding the mass–radius relation is therefore critical for constraining galaxy assembly histories and testing models of galaxy evolution.
To investigate the role of galaxies hosting BP/X structures (and, consequently, the role of barred galaxies) in the mass-size relation of galaxies, we plot the Petrosian radius as a function of stellar mass for control sample and galaxies having strong both-sided BP/X bulges in the top panel of Fig. 7. We did not include both-sided and one-sided sample in this analysis to avoid any bias due to presence of heavy dust lanes, which may lead to their wrong classification in some cases. Also, we used the Petrosian radius (instead of the scale radius) to minimize the effect of dust obscuration and bar evolution on scale radius size. The control and strong both-sided samples are shown using blue and purple color open circles, respectively. We also plot the density contour for both the samples to show the spread of data using their respective colors. To show the size evolution with mass, we plot the median sizes in different mass bins, along with the 16th and 84th percentile ranges using large filled circles. The number of galaxies in each bin are listed at the bottom of the lower panel of the figure. The straight lines are fit to median data points. To avoid the effect of redshift evolution, we have considered only those galaxies which lie within 1σ of the median redshift of our sample (i.e. z = 0.03–0.09). We find that galaxies in the strong both-sided sample are typically smaller in size as compare to galaxies in control. Additionally, the discs with strong both-sided sample show shallower relation than control sample. This shallow trend contributes to large scatter at high-mass end of mass-size relation. However, the scatter in the sample is very high compared to the difference between to samples.
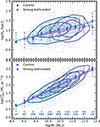 |
Fig. 7. Stellar-mass-size relation (top panel) and stellar-mass-stellar surface density relation (bottom panel) of galaxies hosting BP/X structures. Control and strong both-sided samples are shown in blue and purple colors, respectively. The high-mass discs having strong both-sided BP/X structures are compact and contribute to scatter in these scaling relations at the high-mass end. |
7.5.2. The mass-density relation
Analogously to the mass-radius relations, the mass-density relations shows that more massive galaxies tend to have higher surface density. The early-type galaxies are more compact and centrally concentrated than the late-type galaxies. This correlation reflects the underlying processes governing star formation efficiency, feedback, and mass assembly. For instance, compact massive galaxies at high redshift exhibit high stellar surface densities, suggesting rapid, early star formation followed by quenching and morphological transformation (Barro et al. 2013).
We can study the effect of BP/X hosting galaxies on the mass-density relation of spirals by fitting a straight line in log-log scale similar to the mass-size relation, as shown in the bottom panel of Fig. 7. Again, blue color shows control sample and purple represents strong both-sided bulges. The mass-density relations are significantly stronger than the mass-size relations and show a higher degree of correlation. The galaxies having strong both-sided BP/X structures are typically compact towards high-mass end of the relation. We find that the mass-density relation does not change as significantly as the mass-size relation of galaxies.
8. Summary
In this work, we performed a comprehensive study of BP/X structures in edge-on galaxies obtained from SDSS DR8. We compiled an initial sample of 6684 galaxies with more than 0.9 probability of being edge-on based on more than ten votes in GalaxyZoo survey. We used GALFIT for 2D image decomposition to measure the scale radii and scale heights of galaxies. Furthermore, we used the residual images from 2D decomposition to manually identify BP/X structures in each image and categorized the sample in four classes depending on the signature of BP/X structure: (1) strong both-sided, which are galaxies with clear BP/X structures; (2) both-sided, which are galaxies with faint or clear BP/X structures; (3) one-sided, which are galaxies with excess flux on one side on the galactic plan; and (4) control, which are galaxies without BP/X structures. Additionally, we calculated the mass, distance, and physical size of galaxies. The key points summarizing our study are given below.
-
We visually classified 6653 edge-on galaxies into 1673 (∼25%) both-sided bulges and 1112 (∼17%) one-sided bulges. Among both-sided bulges, 504 (∼8%) are strong both-sided with prominent X-structure, while the remaining 1169 (∼17%) show a faint X-structure. When combined, both-sided and one-sided make up ∼42% (2785 galaxies) of the total sample. Our sample provides the largest catalog of BP/X bulges to date, which includes a category of candidate one-sided BP/X bulges. The catalog of one-sided structures is one of its kind in terms of sampling and likely contains samples of ongoing buckling events in edge-on galaxies.
-
The fraction of one-sided BP/X bulges is always higher than the strong both-sided bulges at any given stellar mass. The fraction of both-sided BP/X bulges is always the highest for any stellar mass. At log(M*/M⊙) = 11.5, the fraction of strong both-sided, one-sided, and both-sided bulges is 18, 26, and 42 per cent, respectively.
-
We report a strong dependence of the BP/X fraction on the average stellar surface density of galaxy. The fraction of BP/X-hosting galaxies increases with the surface density, reflecting bar formation in high-surface-density discs and subsequent BP/X structure growth.
-
We used our catalog to investigate the role of BP/X-hosting galaxies on stellar mass-size relation and stellar mass-stellar surface density relation. We found that galaxies with strong both-sided BP/X structures contribute to the scatter in these relations at high-mass end. However, the scaling relations of control and strong both-sided BP/X show significant overlap in their scatter.
This study provides a classification of BP/X bulges in a large sample of edge-on galaxies, along with their statistical properties and evolutionary trends. We demonstrate the effect of bar formation and evolution on the mass–size and mass–density scaling relations. The analysis uses single-component fitting for size measurements and empirical relations for dust correction and mass estimation, introducing significant scatter in the scaling relations. Future studies employing detailed 2D decomposition for scale size measurements and SED fitting for stellar mass, star formation rate, dust content, and star formation history will be instrumental in the era of large-scale surveys (e.g., Euclid, LSST, 4MOST, and Roman). With the increase in spatial resolution, it will be possible to distinguish between classical bulges and weak BP/X bulges. We will be able to identify the real one-sided BP/X bulge galaxies from the class of one-sided galaxies. Additionally, our sample can be used to train AI models for studying large datasets.
Data availability
The complete catalog used in this work is available at the CDS via https://cdsarc.cds.unistra.fr/viz-bin/cat/J/A+A/706/A89
Acknowledgments
We thank anonymous reviewer for providing constructive feedback and suggestion, which helped improve this paper. AK acknowledges support from ALMA fund with code 31220021 and from ANID BASAL project FB210003. Funding for the Sloan Digital Sky Survey V has been provided by the Alfred P. Sloan Foundation, the Heising-Simons Foundation, the National Science Foundation, and the Participating Institutions. SDSS acknowledges support and resources from the Center for High-Performance Computing at the University of Utah. SDSS telescopes are located at Apache Point Observatory, funded by the Astrophysical Research Consortium and operated by New Mexico State University, and at Las Campanas Observatory, operated by the Carnegie Institution for Science. The SDSS web site is www.sdss.org. SDSS is managed by the Astrophysical Research Consortium for the Participating Institutions of the SDSS Collaboration, including Caltech, The Carnegie Institution for Science, Chilean National Time Allocation Committee (CNTAC) ratified researchers, The Flatiron Institute, the Gotham Participation Group, Harvard University, Heidelberg University, The Johns Hopkins University, L’Ecole polytechnique fédérale de Lausanne (EPFL), Leibniz-Institut für Astrophysik Potsdam (AIP), Max-Planck-Institut für Astronomie (MPIA Heidelberg), Max-Planck-Institut für Extraterrestrische Physik (MPE), Nanjing University, National Astronomical Observatories of China (NAOC), New Mexico State University, The Ohio State University, Pennsylvania State University, Smithsonian Astrophysical Observatory, Space Telescope Science Institute (STScI), the Stellar Astrophysics Participation Group, Universidad Nacional Autónoma de México, University of Arizona, University of Colorado Boulder, University of Illinois at Urbana-Champaign, University of Toronto, University of Utah, University of Virginia, Yale University, and Yunnan University. This publication uses data generated via the zooniverse.org platform, development of which is funded by generous support, including a Global Impact Award from Google, and by a grant from the Alfred P. Sloan Foundation. We make use of Matplotlib (Hunter 2007), Numpy (Harris et al. 2020), Pandas (Wes McKinney 2010; The pandas development team 2020), Scipy (Virtanen et al. 2020a).
References
- Aguerri, J., Méndez-Abreu, J., & Corsini, E. 2009, A&A, 495, 491 [NASA ADS] [CrossRef] [EDP Sciences] [Google Scholar]
- Aihara, H., Prieto, C. A., An, D., et al. 2011, ApJS, 193, 29 [NASA ADS] [CrossRef] [Google Scholar]
- Alonso, M. S., Coldwell, G., & Lambas, D. G. 2013, A&A, 549, A141 [NASA ADS] [CrossRef] [EDP Sciences] [Google Scholar]
- Athanassoula, E. 2003, MNRAS, 341, 1179 [Google Scholar]
- Athanassoula, E. 2005, MNRAS, 358, 1477 [NASA ADS] [CrossRef] [Google Scholar]
- Athanassoula, E., & Martinez-Valpuesta, I. 2008, Chaos in Astronomy (Springer), 77 [Google Scholar]
- Baba, J., & Kawata, D. 2020, MNRAS, 492, 4500 [NASA ADS] [CrossRef] [Google Scholar]
- Barro, G., Faber, S. M., Pérez-González, P. G., et al. 2013, ApJ, 765, 104 [Google Scholar]
- Bell, E. F., McIntosh, D. H., Katz, N., & Weinberg, M. D. 2003, ApJS, 149, 289 [Google Scholar]
- Berentzen, I., Shlosman, I., Martinez-Valpuesta, I., & Heller, C. H. 2007, ApJ, 666, 189 [Google Scholar]
- Bettoni, D., & Galletta, G. 1994, A&A, 281, 1 [NASA ADS] [Google Scholar]
- Blanton, M. R., Hogg, D. W., Bahcall, N. A., et al. 2003, ApJ, 592, 819 [Google Scholar]
- Boone, F., Baker, A. J., Schinnerer, E., et al. 2007, A&A, 471, 113 [NASA ADS] [CrossRef] [EDP Sciences] [Google Scholar]
- Bradley, L., & Developers, P. 2022, https://doi.org/10.5281/zenodo.7419741 [Google Scholar]
- Bureau, M., & Athanassoula, E. 2005, ApJ, 626, 159 [Google Scholar]
- Cervantes Sodi, B. 2017, ApJ, 835, 80 [CrossRef] [Google Scholar]
- Ciambur, B. C., & Graham, A. W. 2016, MNRAS, 459, 1276 [NASA ADS] [CrossRef] [Google Scholar]
- Cole, D. R., Debattista, V. P., Erwin, P., Earp, S. W., & Roškar, R. 2014, MNRAS, 445, 3352 [NASA ADS] [CrossRef] [Google Scholar]
- Collier, A. 2020, MNRAS, 492, 2241 [Google Scholar]
- Combes, F., & Sanders, R. 1981, A&A, 96, 164 [Google Scholar]
- Combes, F., Debbasch, F., Friedli, D., & Pfenniger, D. 1990, A&A, 233, 82 [NASA ADS] [Google Scholar]
- de Sá-Freitas, C., Fragkoudi, F., Gadotti, D. A., et al. 2023, A&A, 671, A8 [NASA ADS] [CrossRef] [EDP Sciences] [Google Scholar]
- De Souza, R., & Dos Anjos, S. 1987, A&AS, 70, 465 [Google Scholar]
- de Vaucouleurs, G., de Vaucouleurs, A., Corwin, Herold G. J., et al. 1991, Third Reference Catalogue of Bright Galaxies (New York, NY: Springer) [Google Scholar]
- Debattista, V. 2018, The Galactic Bulge at the Crossroads, 10 [Google Scholar]
- Debattista, V. P., Mayer, L., Carollo, C. M., et al. 2006, ApJ, 645, 209 [Google Scholar]
- Debattista, V. P., Liddicott, D. J., Khachaturyants, T., & Beraldo e Silva, L. 2020, MNRAS, 498, 3334 [Google Scholar]
- Dey, A., Schlegel, D. J., Lang, D., et al. 2019, AJ, 157, 168 [Google Scholar]
- Di Matteo, P., Haywood, M., Lehnert, M., et al. 2019, A&A, 632, A4 [NASA ADS] [CrossRef] [EDP Sciences] [Google Scholar]
- Díaz-García, S., Salo, H., Laurikainen, E., & Herrera-Endoqui, M. 2016, A&A, 587, A160 [NASA ADS] [CrossRef] [EDP Sciences] [Google Scholar]
- Díaz-García, S., Moyano, F. D., Comerón, S., et al. 2020, A&A, 644, A38 [NASA ADS] [CrossRef] [EDP Sciences] [Google Scholar]
- Donohoe-Keyes, C., Martig, M., James, P., & Kraljic, K. 2019, MNRAS, 489, 4992 [Google Scholar]
- Du, W., & McGaugh, S. S. 2020, AJ, 160, 122 [Google Scholar]
- Erwin, P. 2018, MNRAS, 474, 5372 [Google Scholar]
- Erwin, P., & Debattista, V. P. 2016, ApJ, 825, L30 [NASA ADS] [CrossRef] [Google Scholar]
- Erwin, P., & Debattista, V. P. 2017, MNRAS, 468, 2058 [Google Scholar]
- Faúndez-Abans, M., & de Oliveira-Abans, M. 1998, A&AS, 128, 289 [NASA ADS] [CrossRef] [EDP Sciences] [Google Scholar]
- Fragkoudi, F., Di Matteo, P., Haywood, M., et al. 2017, A&A, 606, A47 [NASA ADS] [CrossRef] [EDP Sciences] [Google Scholar]
- Fraser-McKelvie, A., Aragón-Salamanca, A., Merrifield, M., et al. 2020, MNRAS, 495, 4158 [Google Scholar]
- Friedli, D., & Benz, W. 1993, A&A, 268, 65 [NASA ADS] [Google Scholar]
- Friedli, D., & Benz, W. 1995, A&A, 301, 649 [NASA ADS] [Google Scholar]
- Friedli, D., & Pfenniger, D. 1990, in European Southern Observatory Conference and Workshop Proceedings, eds. B. J. Jarvis, & D. M. Terndrup, Eur. Southern Obs. Conf. Workshop Proc., 35, 265 [Google Scholar]
- Galloway, M. A., Willett, K. W., Fortson, L. F., et al. 2015, MNRAS, 448, 3442 [NASA ADS] [CrossRef] [Google Scholar]
- Garland, I. L., Walmsley, M., Silcock, M. S., et al. 2024, MNRAS, 532, 2320 [NASA ADS] [CrossRef] [Google Scholar]
- Ghosh, S., Fragkoudi, F., Di Matteo, P., & Saha, K. 2024, A&A, 683, A196 [NASA ADS] [CrossRef] [EDP Sciences] [Google Scholar]
- Ginsburg, A., Sipőcz, B. M., Brasseur, C. E., et al. 2019, AJ, 157, 98 [Google Scholar]
- Harris, C. R., Millman, K. J., van der Walt, S. J., et al. 2020, Nature, 585, 357 [NASA ADS] [CrossRef] [Google Scholar]
- Heller, C. H., & Shlosman, I. 1994, ApJ, 424, 84 [NASA ADS] [CrossRef] [Google Scholar]
- Holmberg, E. 1958, Meddelanden fran Lunds Astronomiska Observatorium Serie II, 136, 1 [Google Scholar]
- Hunter, J. D. 2007, Comput. Sci. Eng., 9, 90 [NASA ADS] [CrossRef] [Google Scholar]
- Jarvis, B. J. 1986, AJ, 91, 65 [NASA ADS] [CrossRef] [Google Scholar]
- Kalnajs, A. J. 1972, ApJ, 175, 63 [Google Scholar]
- Kataria, S. K., & Vivek, M. 2024, MNRAS, 527, 3366 [Google Scholar]
- Kautsch, S., Grebel, E., Barazza, F., & Gallagher, J. 2006, A&A, 445, 765 [NASA ADS] [CrossRef] [EDP Sciences] [Google Scholar]
- Khoperskov, S., Haywood, M., Di Matteo, P., Lehnert, M., & Combes, F. 2018, A&A, 609, A60 [NASA ADS] [CrossRef] [EDP Sciences] [Google Scholar]
- Khoperskov, S., Di Matteo, P., Gerhard, O., et al. 2019, A&A, 622, L6 [NASA ADS] [CrossRef] [EDP Sciences] [Google Scholar]
- Kim, S. S., Saitoh, T. R., Jeon, M., et al. 2011, ApJ, 735, L11 [Google Scholar]
- Kruk, S. J., Erwin, P., Debattista, V. P., & Lintott, C. 2019, MNRAS, 490, 4721 [Google Scholar]
- Kuijken, K., & Merrifield, M. R. 1995, ApJ, 443, L13 [NASA ADS] [CrossRef] [Google Scholar]
- Kumar, A. 2023, arXiv e-prints [arXiv:2306.11045] [Google Scholar]
- Kumar, A., & Kataria, S. K. 2022, MNRAS, 514, 2497 [CrossRef] [Google Scholar]
- Kumar, A., Das, M., & Kataria, S. K. 2021, MNRAS, 506, 98 [NASA ADS] [CrossRef] [Google Scholar]
- Kumar, A., Das, M., & Kataria, S. K. 2022, MNRAS, 509, 1262 [Google Scholar]
- Lang, M., Holley-Bockelmann, K., & Sinha, M. 2014, ApJ, 790, L33 [Google Scholar]
- Laurikainen, E., & Salo, H. 2016, Galactic Bulges (Springer), 77 [Google Scholar]
- Li, Z.-Y., Ho, L. C., & Barth, A. J. 2017, ApJ, 845, 87 [Google Scholar]
- Lintott, C. J., Schawinski, K., Slosar, A., et al. 2008, MNRAS, 389, 1179 [NASA ADS] [CrossRef] [Google Scholar]
- Lintott, C., Schawinski, K., Bamford, S., et al. 2010, MNRAS, 410, 166 [Google Scholar]
- Łokas, E. L. 2018, ApJ, 857, 6 [Google Scholar]
- Łokas, E. L. 2019, A&A, 629, A52 [NASA ADS] [CrossRef] [EDP Sciences] [Google Scholar]
- Lütticke, R., Dettmar, R.-J., & Pohlen, M. 2000, A&AS, 145, 405 [NASA ADS] [CrossRef] [EDP Sciences] [Google Scholar]
- Lynden-Bell, D. 1979, MNRAS, 187, 101 [Google Scholar]
- Marchuk, A. A., Smirnov, A. A., Sotnikova, N. Y., et al. 2022, MNRAS, 512, 1371 [NASA ADS] [CrossRef] [Google Scholar]
- Martin, P., & Friedli, D. 1997, A&A, 326, 449 [NASA ADS] [Google Scholar]
- Martinez-Valpuesta, I., Shlosman, I., & Heller, C. 2006, ApJ, 637, 214 [NASA ADS] [CrossRef] [Google Scholar]
- Masters, K. L., Nichol, R. C., Hoyle, B., et al. 2011, MNRAS, 411, 2026 [Google Scholar]
- Melvin, T., Masters, K., Lintott, C., et al. 2014, MNRAS, 438, 2882 [Google Scholar]
- Merritt, D., & Sellwood, J. 1994, ApJ, 425, 551 [NASA ADS] [CrossRef] [Google Scholar]
- Minchev, I., Famaey, B., Combes, F., et al. 2011, A&A, 527, A147 [NASA ADS] [CrossRef] [EDP Sciences] [Google Scholar]
- Miwa, T., & Noguchi, M. 1998, ApJ, 499, 149 [Google Scholar]
- Naab, T., Johansson, P. H., & Ostriker, J. P. 2009, ApJ, 699, L178 [Google Scholar]
- Nair, P. B., & Abraham, R. G. 2010, ApJ, 714, L260 [Google Scholar]
- Nelson, E. J., van Dokkum, P. G., Förster Schreiber, N. M., et al. 2016, ApJ, 828, 27 [Google Scholar]
- Ness, M., & Lang, D. 2016, AJ, 152, 14 [NASA ADS] [CrossRef] [Google Scholar]
- Ostriker, J. P., & Peebles, P. J. E. 1973, ApJ, 186, 467 [Google Scholar]
- Peng, C. Y., Ho, L. C., Impey, C. D., & Rix, H.-W. 2010, AJ, 139, 2097 [Google Scholar]
- Pfenniger, D., & Friedli, D. 1991, A&A, 252, 75 [NASA ADS] [Google Scholar]
- Polyachenko, V., & Polyachenko, E. 2003, Astron. Lett., 29, 447 [Google Scholar]
- Quillen, A. C. 2002, AJ, 124, 722 [NASA ADS] [CrossRef] [Google Scholar]
- Quillen, A. C., Minchev, I., Sharma, S., Qin, Y.-J., & Di Matteo, P. 2014, MNRAS, 437, 1284 [Google Scholar]
- Raha, N., Sellwood, J., James, R., & Kahn, F. 1991, Nature, 352, 411 [Google Scholar]
- Saha, K., Pfenniger, D., & Taam, R. E. 2013, ApJ, 764, 123 [NASA ADS] [CrossRef] [Google Scholar]
- Savchenko, S., Sotnikova, N. Y., Mosenkov, A., Reshetnikov, V., & Bizyaev, D. 2017, MNRAS, 471, 3261 [Google Scholar]
- Savchenko, S. S., Poliakov, D. M., Mosenkov, A. V., et al. 2023, MNRAS, 524, 4729 [Google Scholar]
- Sellwood, J. A. 2014, Rev. Mod. Phys., 86, 1 [Google Scholar]
- Sellwood, J., & Gerhard, O. 2020, MNRAS, 495, 3175 [Google Scholar]
- Seo, W.-Y., Kim, W.-T., Kwak, S., et al. 2019, ApJ, 872, 5 [NASA ADS] [CrossRef] [Google Scholar]
- Shao, Z., Xiao, Q., Shen, S., et al. 2007, ApJ, 659, 1159 [Google Scholar]
- Shaw, M. A. 1987, MNRAS, 229, 691 [Google Scholar]
- Shen, S., Mo, H. J., White, S. D. M., et al. 2003, MNRAS, 343, 978 [NASA ADS] [CrossRef] [Google Scholar]
- Shlosman, I., Frank, J., & Begelman, M. C. 1989, Nature, 338, 45 [Google Scholar]
- Silva-Lima, L. A., Martins, L. P., Coelho, P. R. T., & Gadotti, D. A. 2022, A&A, 661, A105 [NASA ADS] [CrossRef] [EDP Sciences] [Google Scholar]
- Simard, L., Mendel, J. T., Patton, D. R., Ellison, S. L., & McConnachie, A. W. 2011, ApJS, 196, 11 [CrossRef] [Google Scholar]
- Smirnov, A. A., & Sotnikova, N. Y. 2018, MNRAS, 481, 4058 [Google Scholar]
- Smirnov, A. A., & Sotnikova, N. Y. 2019, MNRAS, 485, 1900 [NASA ADS] [CrossRef] [Google Scholar]
- Sormani, M. C., Gerhard, O., Portail, M., Vasiliev, E., & Clarke, J. 2022, MNRAS, 514, L1 [NASA ADS] [CrossRef] [Google Scholar]
- Spinoso, D., Bonoli, S., Dotti, M., et al. 2016, MNRAS, 465, 3729 [Google Scholar]
- Stoughton, C., Lupton, R. H., Bernardi, M., et al. 2002, AJ, 123, 485 [Google Scholar]
- The pandas development team, 2020, pandas-dev/pandas: Pandas [Google Scholar]
- Toomre, A. 1981, in Structure and Evolution of Normal Galaxies, eds. S. M. Fall, & D. Lynden-Bell, 111 [Google Scholar]
- Trujillo, I., Förster Schreiber, N. M., Rudnick, G., et al. 2006, ApJ, 650, 18 [Google Scholar]
- Tully, R. B., & Fisher, J. R. 1977, A&A, 54, 661 [NASA ADS] [Google Scholar]
- van der Kruit, P. C., & Freeman, K. C. 2011, ARA&A, 49, 301 [Google Scholar]
- Van der Kruit, P., & Searle, L. 1981, A&A, 95, 105 [NASA ADS] [Google Scholar]
- van der Wel, A., Franx, M., van Dokkum, P. G., et al. 2014, ApJ, 788, 28 [Google Scholar]
- van Dokkum, P. G., Whitaker, K. E., Brammer, G., et al. 2010, ApJ, 709, 1018 [Google Scholar]
- Veilleux, S., Bland-Hawthorn, J., & Cecil, G. 1999, AJ, 118, 2108 [NASA ADS] [CrossRef] [Google Scholar]
- Virtanen, P., Gommers, R., Oliphant, T. E., et al. 2020a, Nat. Methods, 17, 261 [Google Scholar]
- Wes McKinney 2010, in Proceedings of the 9th Python in Science Conference, eds. S. van der Walt, & J. Millman, 56 [Google Scholar]
- Wozniak, H. 2007, A&A, 465, L1 [NASA ADS] [CrossRef] [EDP Sciences] [Google Scholar]
- Xiang, K. M., Nataf, D. M., Athanassoula, E., et al. 2021, ApJ, 909, 125 [Google Scholar]
- York, D. G., Adelman, J., Anderson, J. E., Jr, et al. 2000, AJ, 120, 1579 [Google Scholar]
- Yoshino, A., & Yamauchi, C. 2015, MNRAS, 446, 3749 [Google Scholar]
- Yuan, H.-B., Liu, X.-W., & Xiang, M.-S. 2013, MNRAS, 430, 2188 [NASA ADS] [CrossRef] [Google Scholar]
- Zozulia, V. D., Smirnov, A. A., & Sotnikova, N. Y. 2024a, MNRAS, 529, 4405 [CrossRef] [Google Scholar]
- Zozulia, V. D., Smirnov, A. A., Sotnikova, N. Y., & Marchuk, A. A. 2024b, A&A, 692, A145 [NASA ADS] [CrossRef] [EDP Sciences] [Google Scholar]
- Zozulia, V. D., Sotnikova, N. Y., & Smirnov, A. A. 2025, A&A, 698, L26 [NASA ADS] [CrossRef] [EDP Sciences] [Google Scholar]
Appendix A: More examples of sample galaxies
To provide a clear overview of the different categories of galaxies with BP/X bulges defined in this study, we present mosaic images for each category. Fig. A.1 shows a mosaic of strong, both-sided BP/X bulges; Fig. A.2 displays a mosaic of weak, both-sided BP/X bulges; and Fig. A.3 exhibits a mosaic of one-sided BP/X bulges. Each panel in these images shows the residuals obtained by subtracting the model images from the observed ones. The color scales in each panel are adjusted to enhance the visibility of structural features.
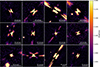 |
Fig. A.1. Strong both-sided residual images, where the X shape can be clearly distinguished from the background. |
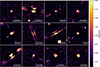 |
Fig. A.2. Residual images classified to have weak both-sided bulge due the presence of some nonzero residue at the center of the galaxy but the same is not clearly an X shape. |
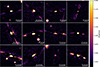 |
Fig. A.3. Residual images classified to as having a one-sided bulge due the presence of some nonzero residue at one side of the mid-plane of galaxy. |
Appendix B: Effect of measuring surface density using the scale radius
In Section 7.4, we discuss the dependence of the BP/X bulge-hosting galaxy fraction on the average stellar surface density, measured by assuming all stellar mass lies within the Petrosian radius. Here, we examine the effect of using the disk scale radius instead for calculating the average stellar density. Specifically, we compute the average stellar surface density under the assumption that all stellar mass is contained within five scale radii, and define it as  . Using a larger or smaller number of scale radii for this calculation does not affect the analysis qualitatively, as it merely scales the density by a constant factor. In Fig. B.1, we present the BP/X fraction as a function of
  for three bulge categories. For comparison with Fig. 6, we limit the average density range in the range of that shown in Fig. 6, scaled by a factor of ≈0.3, which corresponds to the average value of (Rp)2/(5Rs)2. The results are highly consistent with those presented in Section 7.4, showing that the fraction of BP/X bulges increases with increasing stellar surface density. There are very small differences at low and high surface density ends, likely due to the small sample size.
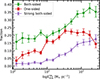 |
Fig. B.1. Fraction of both-sided (green), one-sided (red), and strong both-sided (purple) BP/X structures as a function of average surface density of galaxies. The high-surface-density discs host more BP/X structures than the low-surface density discs using the scale radius. |
Similarly to the mass-density relation discussed in Section 7.5, which assumes total mass within the Petrosian radius, we investigate the effect of using the scale radius in Fig. B.2. Here, we show the mass–size relation in the top panel and the mass–density relation in the bottom panel, using the scale radius instead of the Petrosian radius. In contrast to the trends in Fig. 7, both the control and strong both-sided BP/X bulge samples now show similar trends. This is likely due to the effects of bar thickening and dust distribution in galaxies, which influence scale radius measurements.
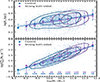 |
Fig. B.2. Stellar mass–size relation (top panel) and stellar mass–stellar surface density relation (bottom panel) for galaxies hosting BP/X structures. The control and strong both-sided samples are displayed in blue and purple, respectively. Both samples now exhibit nearly similar trends with negligible differences. |
All Figures
|
Fig. 1. Comparison of the fitted position angle, radius, and axial ratio between the edge-on disk profile fitting by GALFIT and exponential disk profile fit parameters in SDSS. The red line in left most and middle panel gives the line corresponding to y = x. In the rightmost panel, the fitting line is given in red with the fitting parameters. Finally, Z0 is the disk height and Rs denotes the scale radius obtained from GALFIT. |
| In the text | |
|
Fig. 2. Four galaxies included in our sample, shown in the first row. The model fitted using GALFIT for the corresponding galaxy above it is in the second row. The third row gives the residual image of the corresponding galaxy above it. Each column of figures gives an example of galaxies classified as strong both-sided, weak both-sided, one-sided, and control, respectively, from left to right. The white scale bar marks the scale of 10 arcsec. |
| In the text | |
|
Fig. 3. Absolute r-band magnitude, redshift, angular scale radius, and mass distribution of galaxies in our base sample. The red vertical lines correspond to median values, and the dark shaded regions show the 16th to 84th percentiles range of the distributions. |
| In the text | |
|
Fig. 4. Distribution of different parameters along with the “log norm” fitting parameters for the distributions of mass, axial ratio, scale height, and radius for different samples classified according to the presence (or absence) of a BP/X bulge. |
| In the text | |
|
Fig. 5. Fraction of galaxies hosting both-sided (green), one-sided (red) and strong both-sided (purple) BP/X structures as a function of their stellar mass. Fraction of BP/X hosting galaxies is seen to increase with their stellar mass. |
| In the text | |
|
Fig. 6. Fraction of both-sided (green), one-sided (red), and strong both-sided (purple) BP/X structures as a function of average surface density of galaxies. The high-surface-density discs tend to host more BP/X structures than the low-surface density discs. |
| In the text | |
|
Fig. 7. Stellar-mass-size relation (top panel) and stellar-mass-stellar surface density relation (bottom panel) of galaxies hosting BP/X structures. Control and strong both-sided samples are shown in blue and purple colors, respectively. The high-mass discs having strong both-sided BP/X structures are compact and contribute to scatter in these scaling relations at the high-mass end. |
| In the text | |
|
Fig. A.1. Strong both-sided residual images, where the X shape can be clearly distinguished from the background. |
| In the text | |
|
Fig. A.2. Residual images classified to have weak both-sided bulge due the presence of some nonzero residue at the center of the galaxy but the same is not clearly an X shape. |
| In the text | |
|
Fig. A.3. Residual images classified to as having a one-sided bulge due the presence of some nonzero residue at one side of the mid-plane of galaxy. |
| In the text | |
|
Fig. B.1. Fraction of both-sided (green), one-sided (red), and strong both-sided (purple) BP/X structures as a function of average surface density of galaxies. The high-surface-density discs host more BP/X structures than the low-surface density discs using the scale radius. |
| In the text | |
|
Fig. B.2. Stellar mass–size relation (top panel) and stellar mass–stellar surface density relation (bottom panel) for galaxies hosting BP/X structures. The control and strong both-sided samples are displayed in blue and purple, respectively. Both samples now exhibit nearly similar trends with negligible differences. |
| In the text | |
Current usage metrics show cumulative count of Article Views (full-text article views including HTML views, PDF and ePub downloads, according to the available data) and Abstracts Views on Vision4Press platform.
Data correspond to usage on the plateform after 2015. The current usage metrics is available 48-96 hours after online publication and is updated daily on week days.
Initial download of the metrics may take a while.