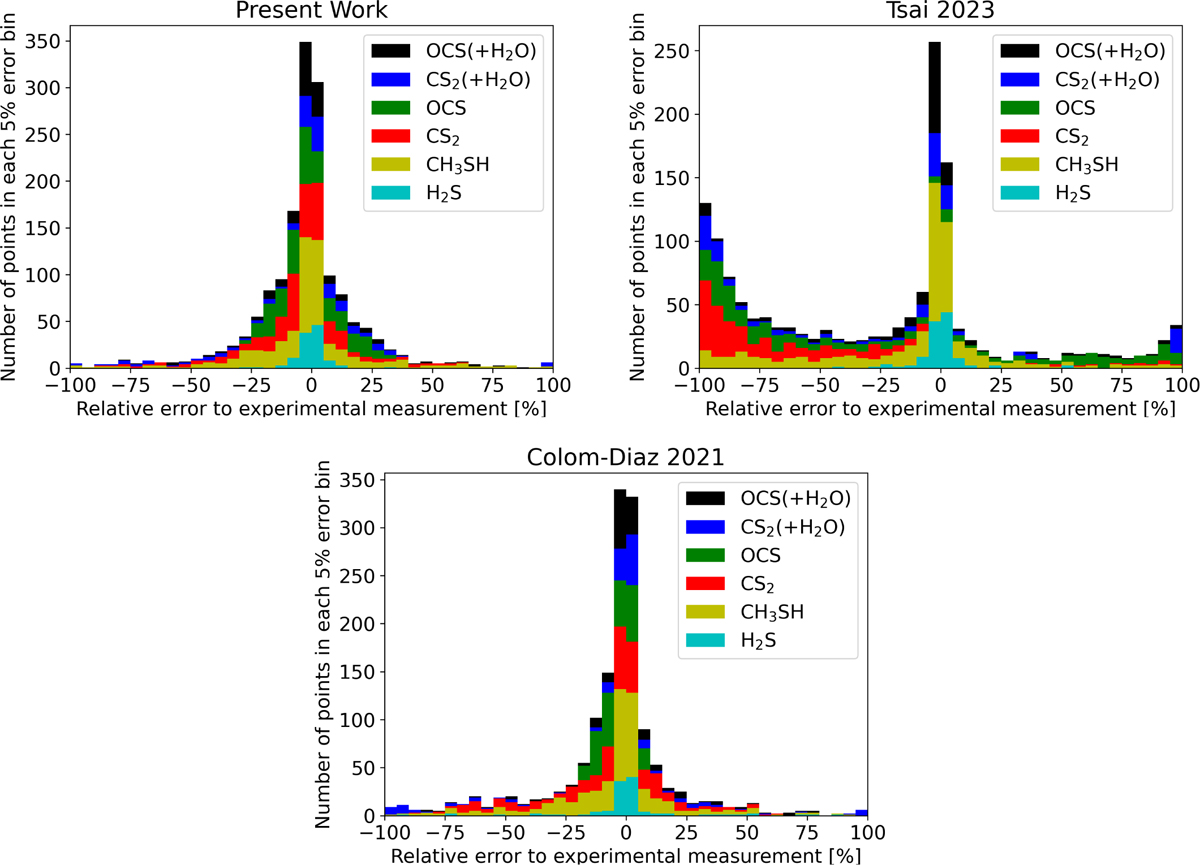
Fig. D.1
Download original image
Distribution of each kinetic network prediction errors on the entire experimental dataset, computed as detailed in Veillet et al. (2024). Data is grouped between different conditions of each reference publication in the bataset, based on the fuel studied. The resulting species groups are therefore H2S from Stagni et al. (2022) for conditions 1 to 2 (in cyan), CH3SH from Alzueta et al. (2019) for conditions 3 to 6 (in yellow), CS2 from Zeng et al. (2019) for conditions 7 to 9 (in red), OCS from Zeng et al. (2021) for conditions 10 to 12 (in green), CS2 and OCS with H2O from Abián et al. (2015) for conditions 13 to 15 (in blue) and 16 to 18 (in black). Each condition reference number can be found in Table 1. CH3SH data with water are included in the same group as dry conditions to reduce visual clutter.
Current usage metrics show cumulative count of Article Views (full-text article views including HTML views, PDF and ePub downloads, according to the available data) and Abstracts Views on Vision4Press platform.
Data correspond to usage on the plateform after 2015. The current usage metrics is available 48-96 hours after online publication and is updated daily on week days.
Initial download of the metrics may take a while.