Open Access
Fig. D.2.
Download original image
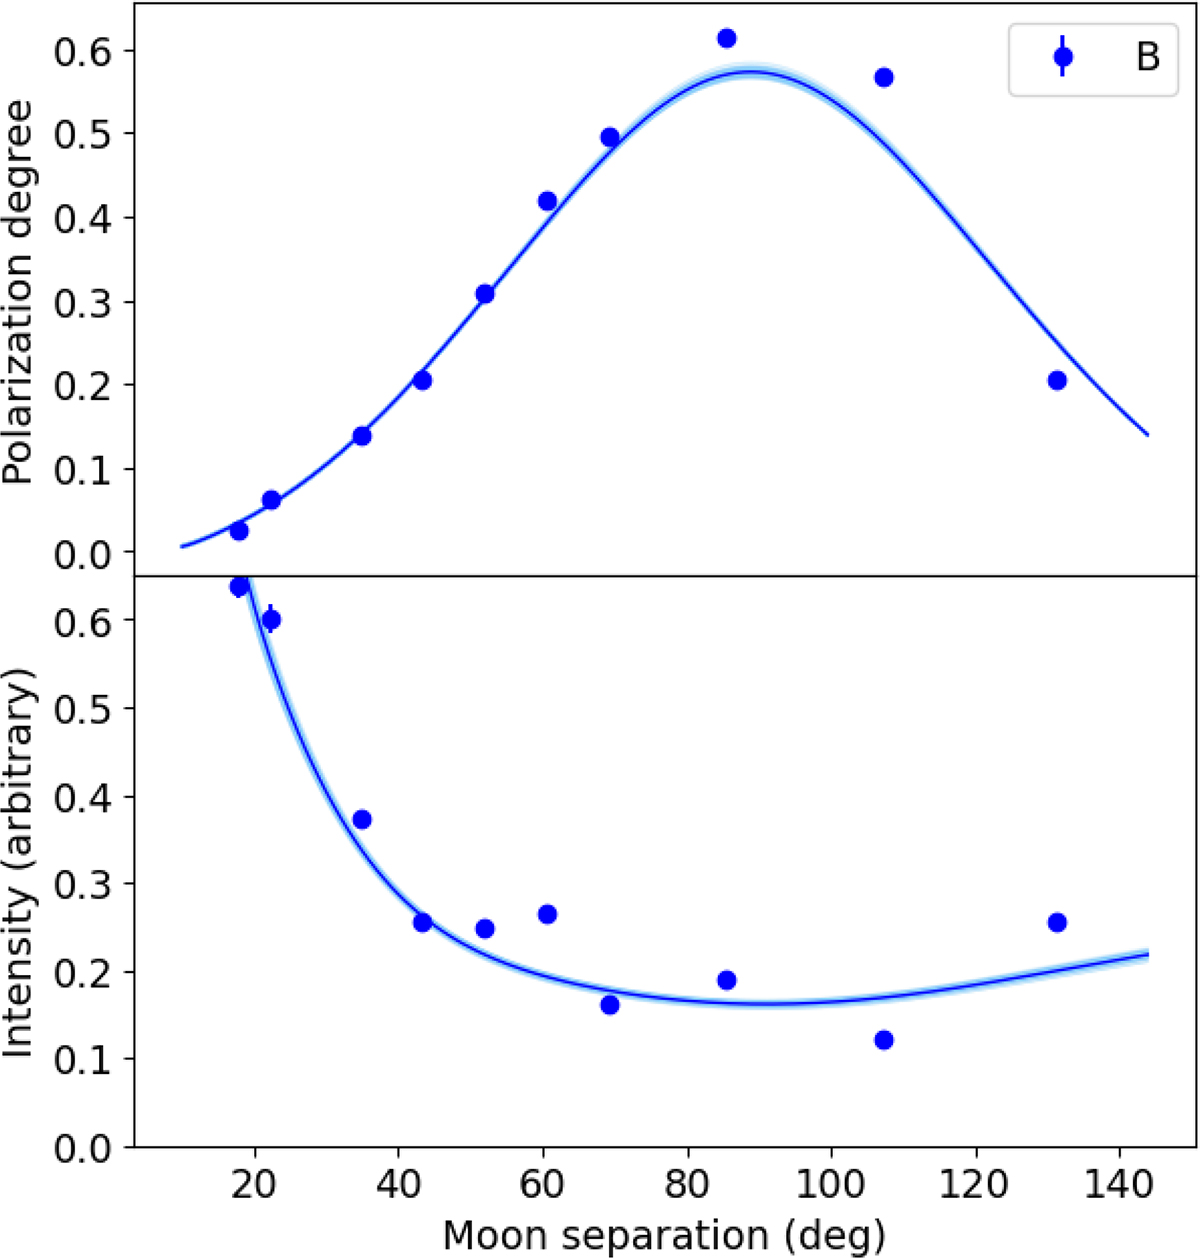
Rayleigh-Mie-MS fit (blue lines) to B-band polarization data (upper) and intensity data (lower). Uncertainties are smaller than the data points. The dark and light blue lines represent the median and 200 realizations drawn from the posterior distribution of the MCMC, respectively.
Current usage metrics show cumulative count of Article Views (full-text article views including HTML views, PDF and ePub downloads, according to the available data) and Abstracts Views on Vision4Press platform.
Data correspond to usage on the plateform after 2015. The current usage metrics is available 48-96 hours after online publication and is updated daily on week days.
Initial download of the metrics may take a while.