Open Access
Fig. 15
Download original image
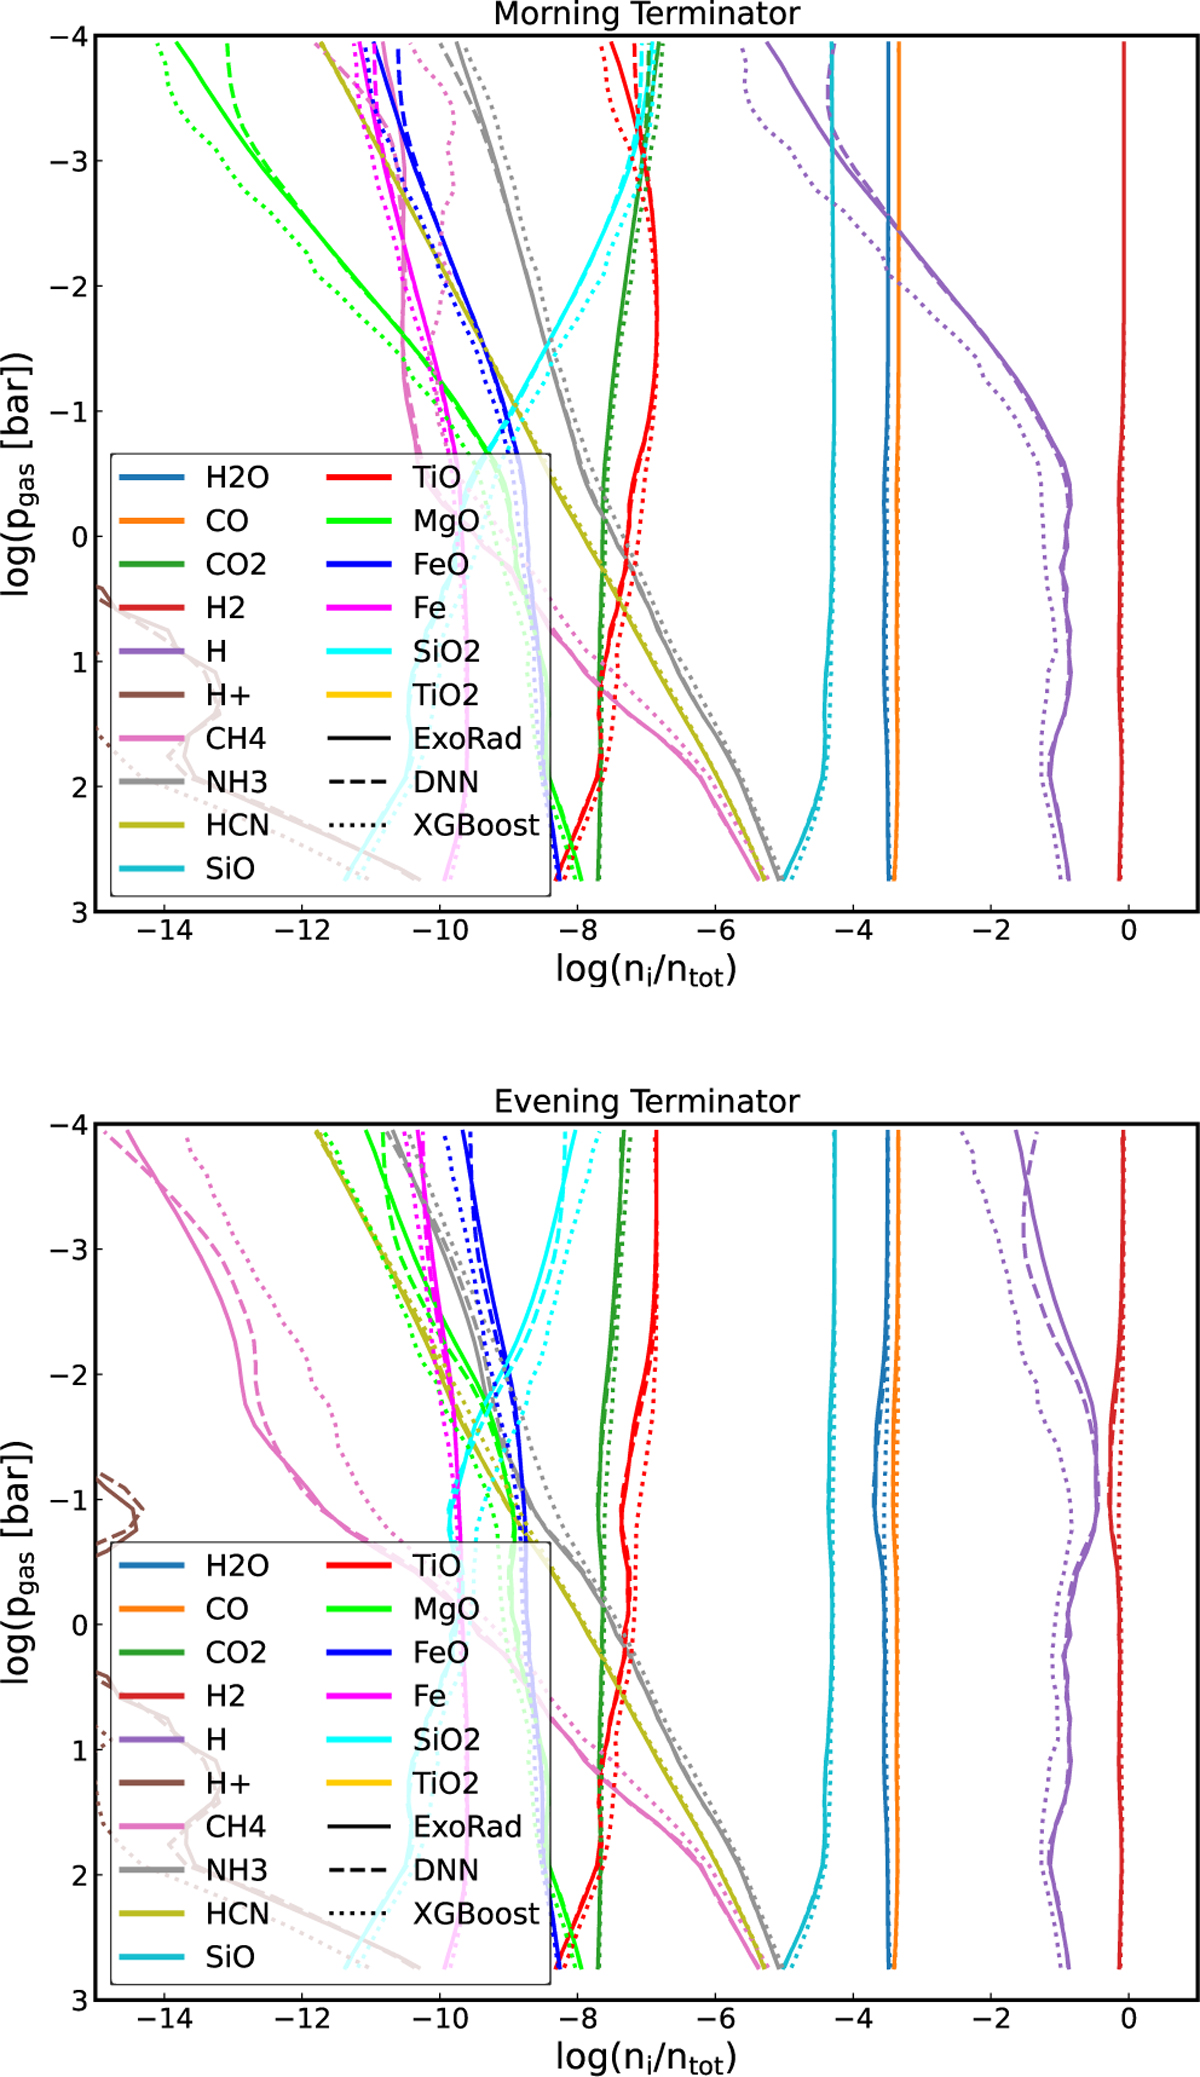
WASP-121 b* morning (top) and evening (bottom) terminator gas phase chemistry for selected species. The solid line shows the ExoRad simulated values, the dashed line shows the DNN prediction, and the dotted line indicates the XGBoost prediction.
Current usage metrics show cumulative count of Article Views (full-text article views including HTML views, PDF and ePub downloads, according to the available data) and Abstracts Views on Vision4Press platform.
Data correspond to usage on the plateform after 2015. The current usage metrics is available 48-96 hours after online publication and is updated daily on week days.
Initial download of the metrics may take a while.