Fig. 1.
Download original image
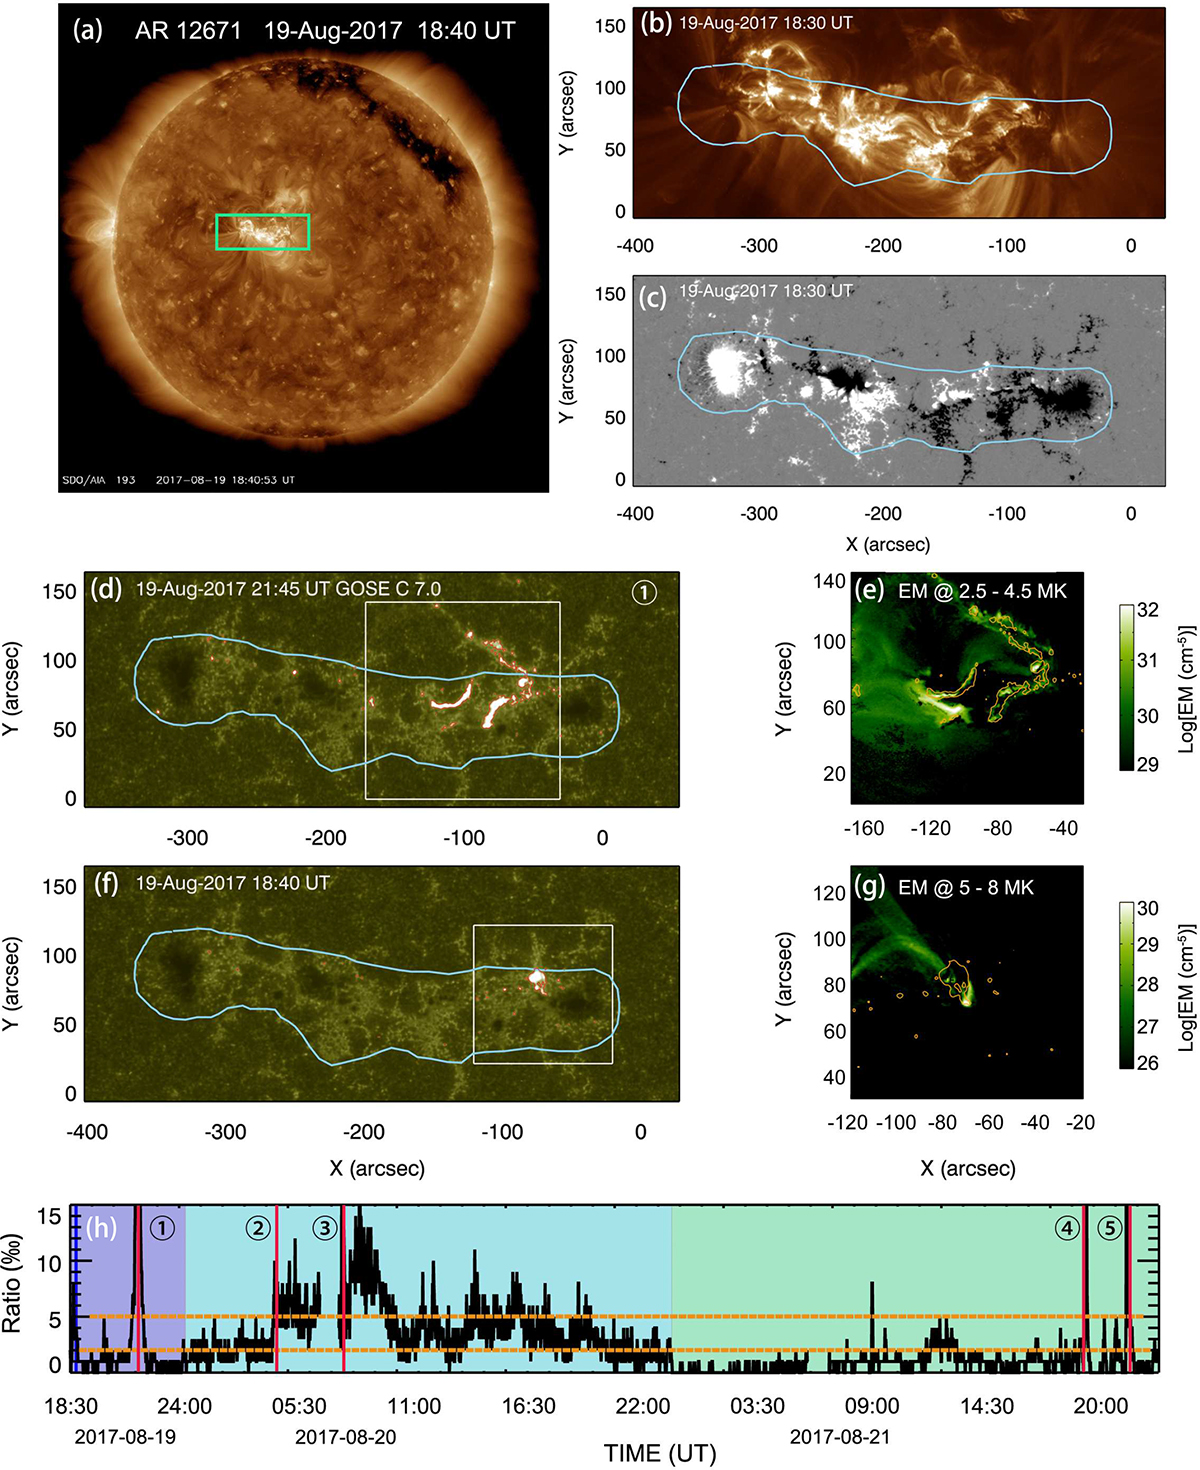
Remote sensing properties of AR 12671. Panel (a) displays the AIA 193 Å full-disk coronal image. The green box corresponds to the position of AR 12671. Panel (b) shows the AIA 193 Å coronal map of AR 12671. Panel (c) displays the photospheric magnetic field map of AR 12671, with the solid blue line outlining the MCA. Panel (d) shows the AIA 1600 Å image corresponding to the C 7.0 flare that occurred at 21:45 UT on August 19, 2017. Panel (f) shows a small-scale chromospheric brightening event that occurred at 18:40 UT on August 19, 2017. The brightening regions are outlined by the solid red line. Panel (e) shows the 2.5–4.5 MK EM of the area outlined with a white box in Panel (d), with the orange line contouring the brightening regions. Panel (h) displays the evolution curve of the PBA over time. The vertical axis represents the ratio value of brightening areas and the whole AR ×1000. The three days of AR 12671 at the center of the solar disk are highlighted with purple, blue, and green shades, respectively. Vertical red lines (&#Xtextcircled;1–&#Xtextcircled;5) mark the time of five GOSE flares. The vertical blue line marks the time of small-scale chromospheric brightening. We can see that AR 12671 exhibited significant chromospheric activity during its time at the solar disk center.
Current usage metrics show cumulative count of Article Views (full-text article views including HTML views, PDF and ePub downloads, according to the available data) and Abstracts Views on Vision4Press platform.
Data correspond to usage on the plateform after 2015. The current usage metrics is available 48-96 hours after online publication and is updated daily on week days.
Initial download of the metrics may take a while.