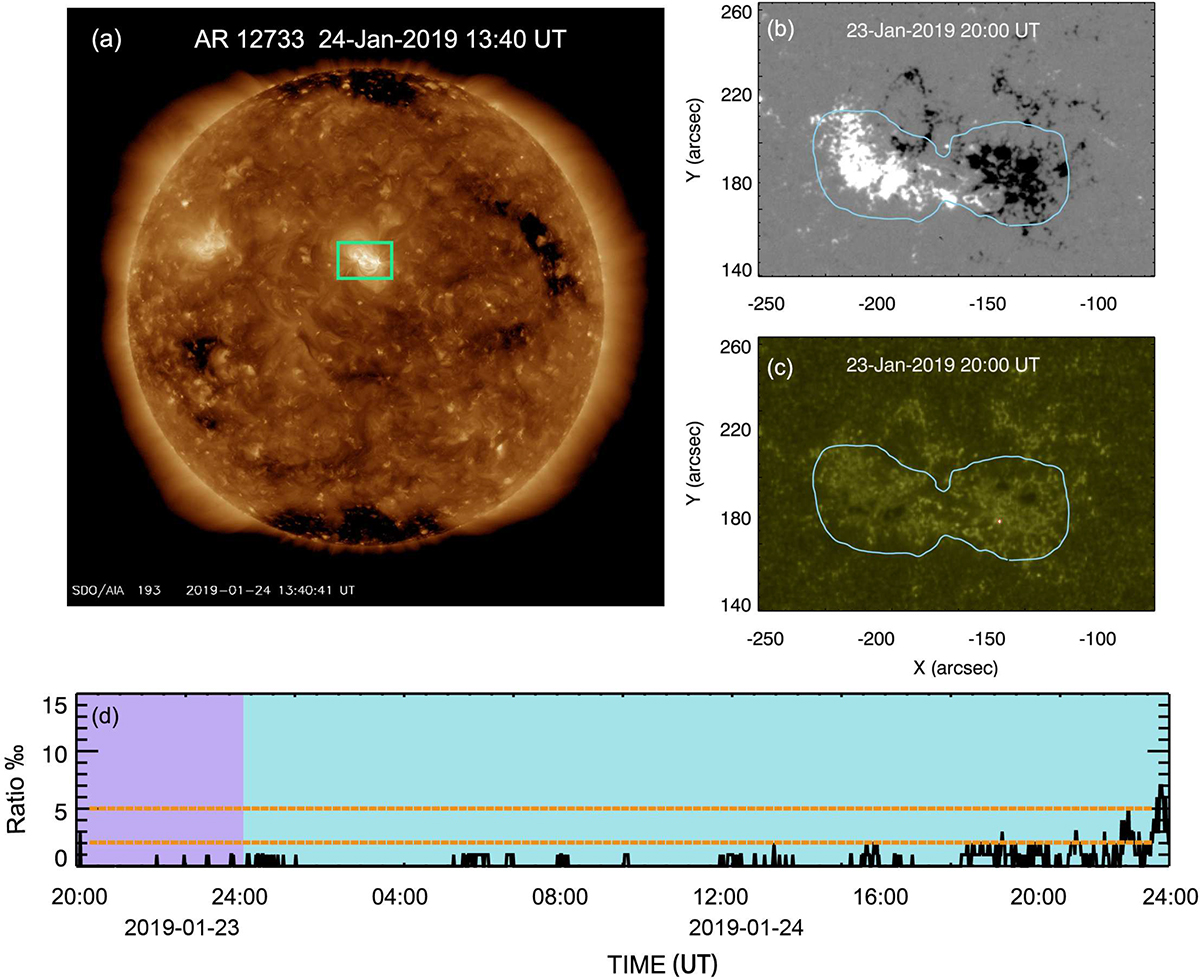
Fig. 2.
Download original image
Remote sensing properties of AR 12733. Panel (a) presents the AIA 193 Åfull-disk coronal image. The green box corresponds to the position of AR 12733. Panel (b) shows the photospheric magnetic field map of the AR, with the solid blue line outlining the MCA. Panel (c) shows AIA 1600 Åchromospheric images. Panel (d) displays the evolution curve of the ratio between the brightening regions identified in AIA 1600 Å images and the MCA regions over time. Two specific days, when AR 12733 was at the solar disk center, are highlighted with purple and blue shading.
Current usage metrics show cumulative count of Article Views (full-text article views including HTML views, PDF and ePub downloads, according to the available data) and Abstracts Views on Vision4Press platform.
Data correspond to usage on the plateform after 2015. The current usage metrics is available 48-96 hours after online publication and is updated daily on week days.
Initial download of the metrics may take a while.