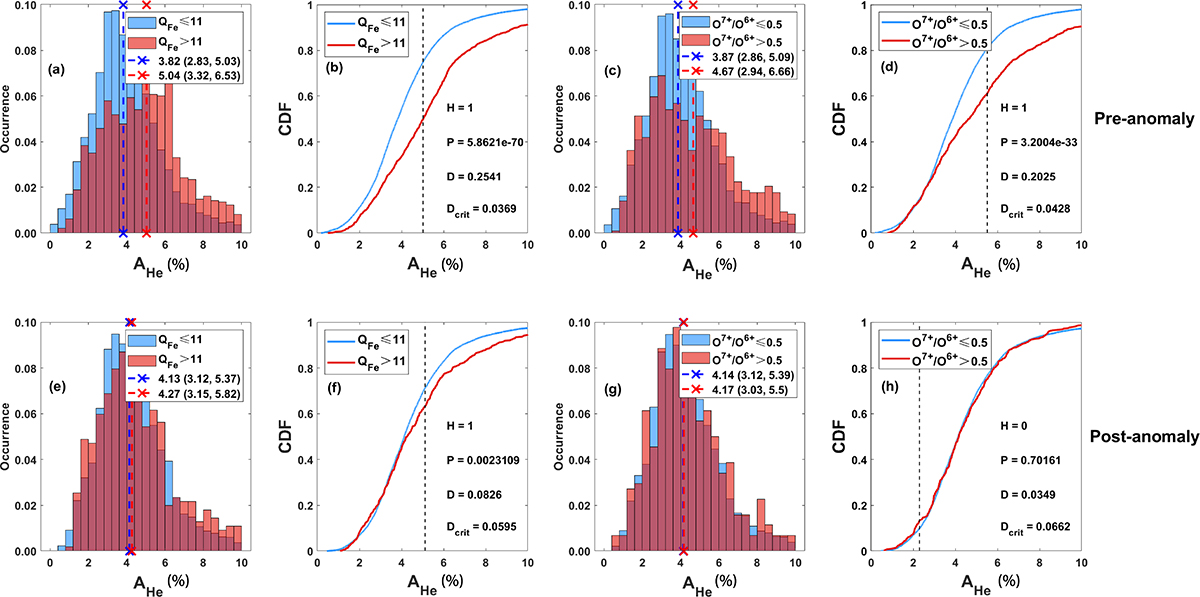
Fig. 4.
Download original image
AHe in the AR solar wind with higher and lower charge states. The top and bottom rows represent the solar wind before and after the anomaly occurred, respectively. The first column displays the distribution of AHe in AR solar wind with QFe greater and less than 11, before and after the anomaly. The blue bars represent AR solar wind with QFe less than 11. The red bars represent AR wind with QFe greater than 11. The vertical dotted blue and red lines represent the median AHe of them. The second column shows the CDF curves of AHe in AR solar wind with QFe above and below 11. The vertical dotted black line marks the maximum vertical deviation between the two curves. D represents the maximum deviation value. The third column shows the distribution of AHe in AR solar wind with O7+/O6+ above and below 0.5, before and after the anomaly. The blue bar represents O7+/O6+ less than 0.5, and the red bar represents AR wind with O7+/O6+ greater than 0.5. The fourth column displays the CDF curves of AHe in AR solar wind with O7+/O6+ above and below 0.5.
Current usage metrics show cumulative count of Article Views (full-text article views including HTML views, PDF and ePub downloads, according to the available data) and Abstracts Views on Vision4Press platform.
Data correspond to usage on the plateform after 2015. The current usage metrics is available 48-96 hours after online publication and is updated daily on week days.
Initial download of the metrics may take a while.