Open Access
Fig. A.1.
Download original image
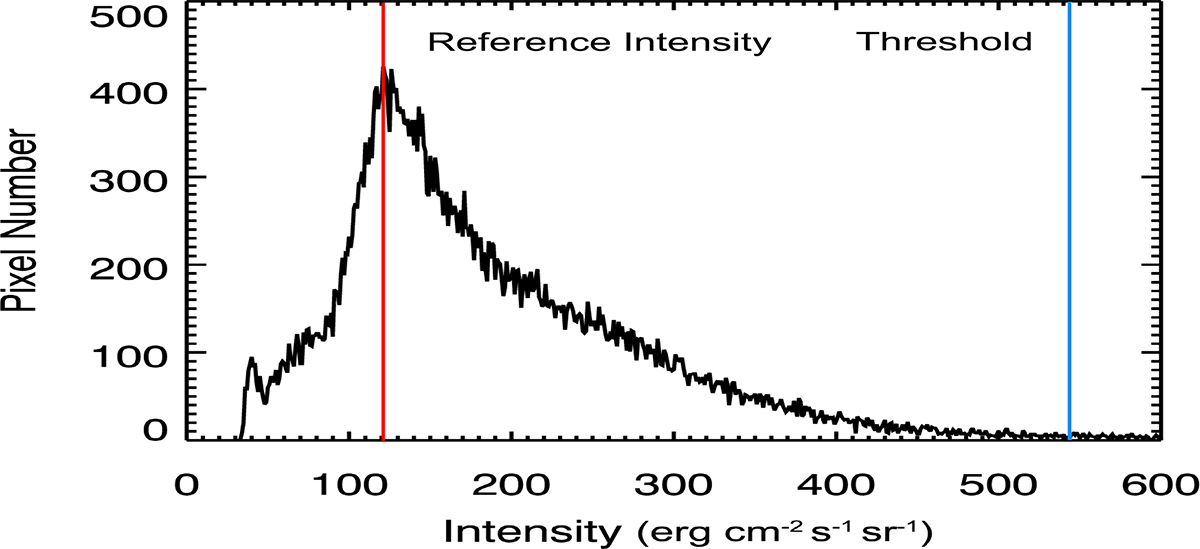
Histogram of intensity distribution within the MCAs. The red line on the left indicates the reference intensity. It represents the intensity value corresponding to the maximum number of pixels. The blue line on the right marks the threshold.
Current usage metrics show cumulative count of Article Views (full-text article views including HTML views, PDF and ePub downloads, according to the available data) and Abstracts Views on Vision4Press platform.
Data correspond to usage on the plateform after 2015. The current usage metrics is available 48-96 hours after online publication and is updated daily on week days.
Initial download of the metrics may take a while.