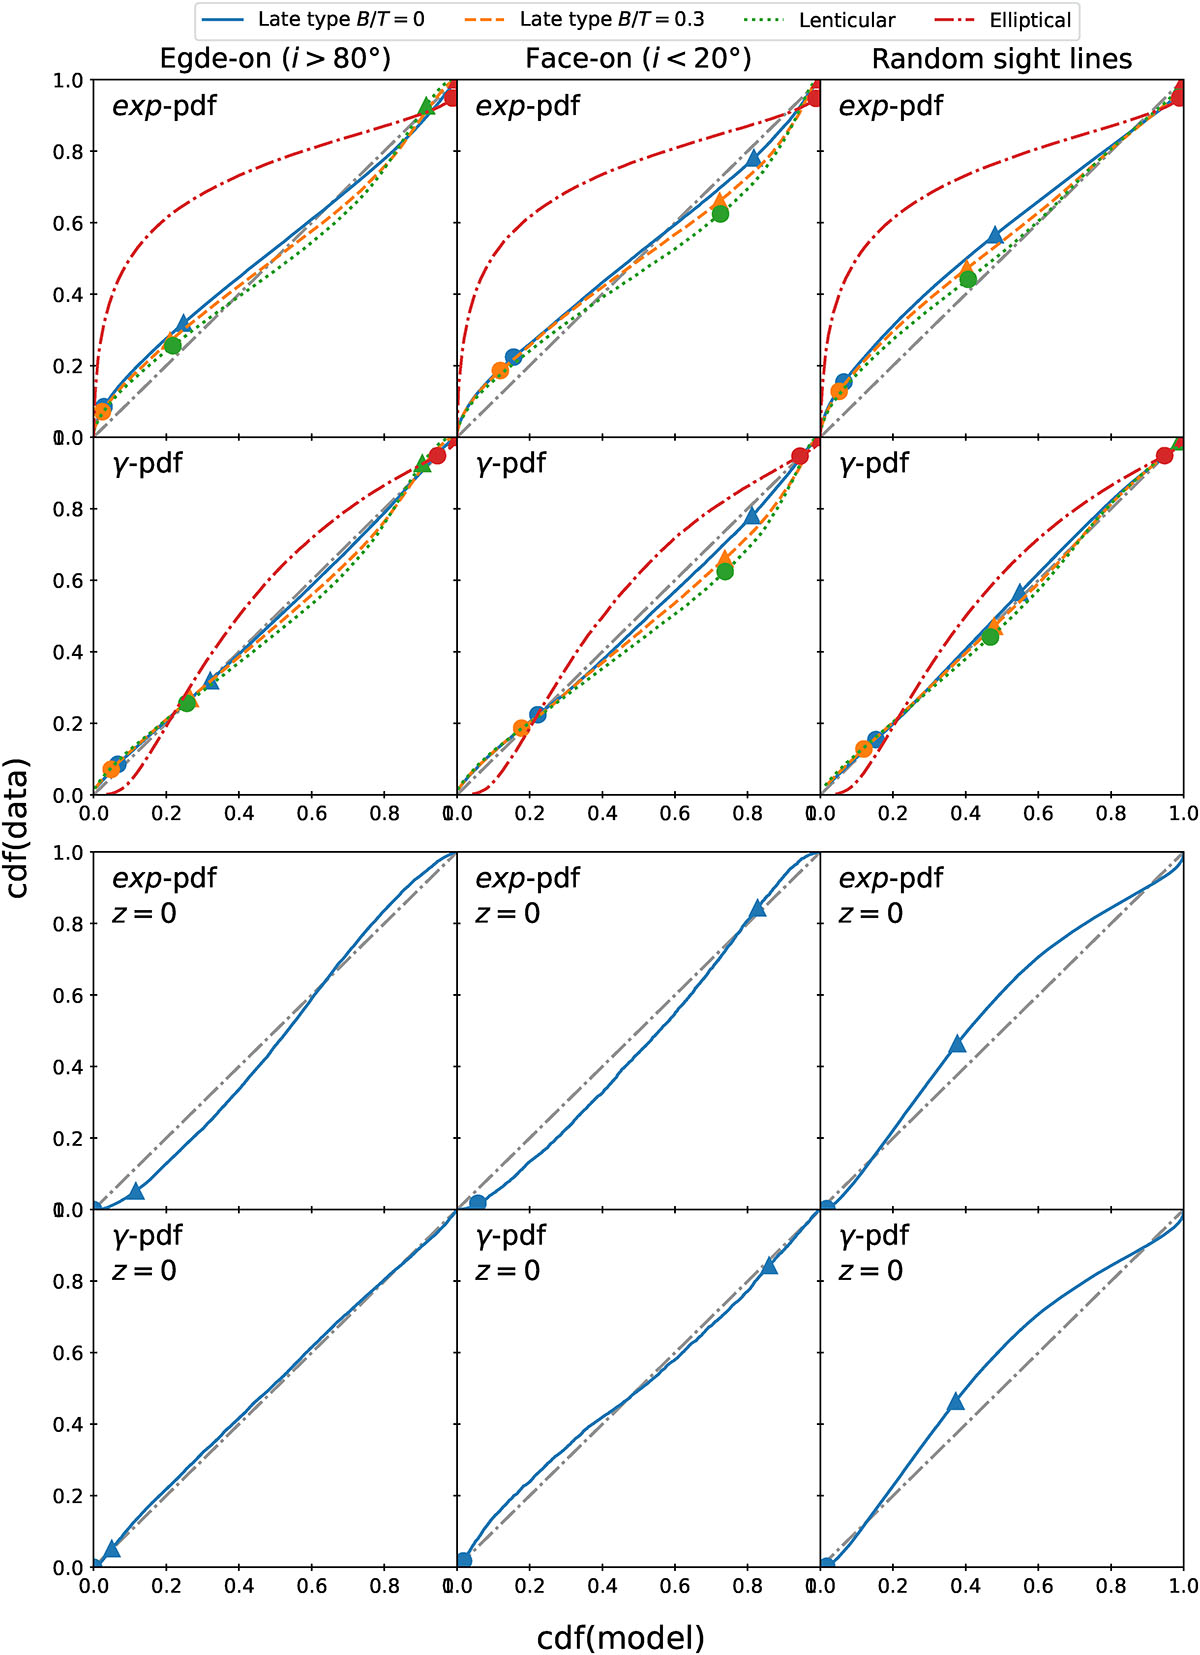
Fig. 5.
Download original image
Comparison between the cumulative distribution of simulated host-galaxy reddening E(B − V) (y-axis) and its approximation (x-axis) given by the best-fit exponential (exp-pdf) or γ-distribution (γ-pdf) model. Each panel in the upper half shows results for four morphological types of simulated host galaxies: LT (with B/T = 0 and B/T = 0.3), S0 type and ET. The columns show three cases of different galaxy-observer orientations: edge-on (left), face-on (middle), and random (right). The bottom panels show analogous comparison for SNe originating from the z = 0 plane of the dust disc in the LT host-galaxy model (B/T = 0). The symbols denote two characteristic scales of reddening with E(B − V) = 0.01 mag (•) and E(B − V) = 0.1 mag (▴), as given by the simulated distributions. The exponential model underestimates the probability of zero reddening, especially in the ET host galaxies. The simulated data are better reproduced by the γ-distribution. For type Ia SNe originating from the proximity of the z = 0 disc plane, the exponential model overpredicts the SN rate with E(B − V)≈0.
Current usage metrics show cumulative count of Article Views (full-text article views including HTML views, PDF and ePub downloads, according to the available data) and Abstracts Views on Vision4Press platform.
Data correspond to usage on the plateform after 2015. The current usage metrics is available 48-96 hours after online publication and is updated daily on week days.
Initial download of the metrics may take a while.