| Issue |
A&A
Volume 706, February 2026
|
|
|---|---|---|
| Article Number | A129 | |
| Number of page(s) | 12 | |
| Section | Extragalactic astronomy | |
| DOI | https://doi.org/10.1051/0004-6361/202555686 | |
| Published online | 05 February 2026 | |
Diverse reddening distributions in sight lines for type Ia supernovae
1
DARK, Niels Bohr Institute, University of Copenhagen Jagtvej 155 2200 Copenhagen, Denmark
2
Department of Physics and Astronomy, University of Missouri 701 S. College Ave. Columbia MO 65203, USA
★ Corresponding authors: This email address is being protected from spambots. You need JavaScript enabled to view it.
; This email address is being protected from spambots. You need JavaScript enabled to view it.
Received:
27
May
2025
Accepted:
16
November
2025
Abstract
Context. Accurate cosmological constraints from type Ia supernovae (SNe) require sufficiently accurate corrections for host-galaxy extinction. Modelling these corrections is challenged by the problem of disentangling the SN’s intrinsic colours from host-galaxy interstellar reddening. The latter is commonly modelled in a probabilistic way assuming an exponential distribution exp(−E(B − V)/τ) as a universal prior, applied across all types of SN host galaxies.
Aims. We tested the robustness of the exponential model of host-galaxy reddening and its universality against predictions based on simulating dust and type Ia SN distributions in host galaxies of different morphological types.
Methods. Our simulations incorporated up-to-date observational constraints on dust masses across host-galaxy morphological types, scaling relations between the dust and stellar disc parameters, and the SN distribution.
Results. We find substantial differences between predicted interstellar reddening in late- (LT) and early-type (ET) host galaxies, primarily driven by the stellar-to-dust mass ratios. The mean simulated reddening in LT galaxies matches those derived from type Ia SN observations well, but it is significantly lower for ET host galaxies. The obtained reddening distributions exhibit an excess of sight lines with zero reddening with respect to the commonly used exponential model, although the difference is quite mild for LT galaxies. On the other hand, the distribution could peak at E(B − V) > 0 when considering a population of young type Ia SNe originating from lower heights within the dust disc of spiral galaxies.
Conclusions. The reddening distribution strongly depends on the SN host-galaxy morphological type. Assuming a universal reddening prior distribution for modelling the peak magnitude-colour relation, which is currently a common practice, gives rise to a spurious scatter in the derived extinction properties. It could also bias relative distances between SNe originating from different host-galaxy populations. The discrepancy between the simulated reddening in average ET host galaxies and the observed occurrence of reddened SNe in these galaxies suggests that reddening does not originate from the interstellar dust expected in these hosts.
Key words: supernovae: general / dust, extinction / distance scale
© The Authors 2026
 Open Access article, published by EDP Sciences, under the terms of the Creative Commons Attribution License (https://creativecommons.org/licenses/by/4.0), which permits unrestricted use, distribution, and reproduction in any medium, provided the original work is properly cited.
This article is published in open access under the Subscribe to Open model. This email address is being protected from spambots. You need JavaScript enabled to view it. to support open access publication.
1. Introduction
Type Ia supernovae (SNe) have long been used to measure cosmological distances and place constraints on cosmological parameters. They have played a key role in the discovery of cosmic acceleration and in laying the observational foundation for the concordance with the Λ cold dark matter (ΛCDM) cosmological model (Riess et al. 1998; Perlmutter et al. 1999). The use of type Ia SNe as a cosmological probe was enabled both by the advent of large survey for time-domain astronomy and the development of a range of corrections required to make them effective standard candles. The ongoing progress both in terms of observations and standardisation models aims at achieving sufficient accuracy for constraining the dark energy equation of state. However, many challenges remain. The three largest SN compilations to date, Pantheon+ (Brout et al. 2022), Union3 (Rubin et al. 2025), and DESY5 (DES Collaboration 2024), were recently used in combination with the BAO measurements from DESI (Adame et al. 2025) to constrain the dark energy equation of state, result in surprisingly large relative shifts between best-fit cosmological parameters (Cortês & Liddle 2025). The apparent sensitivity of cosmological constraints to the choice of SN compilation reflects the magnitude of systematic errors for which the most dominant effects tend to bias cosmological results towards evolving dark energy (Dhawan et al. 2025).
The present and future accuracy of measuring cosmological distances with type Ia SNe critically relies on developing our understanding of a range of assumptions employed by the standardisation models. Arguably, the most problematic aspect of it is the so-called colour correction, which aims to account for the observed relation between SN peak absolute luminosity and its apparent colour. The complexity of this relation results from the fact that it is driven by two independent physical effects, SN intrinsic emission and host-galaxy extinction, for which the relevant variables are a priori unknown. These two effects can be disentangled in a probabilistic way by modelling type Ia SN samples. This approach was applied to a wide range of SN datasets, either as a part of light curve analysis (see e.g. Mandel et al. 2022; Ward et al. 2023; Thorp & Mandel 2022) or as a post-processing analysis of SN colours derived from light curve fitting (see e.g. Mandel et al. 2011, 2017; Brout & Scolnic 2021; Wojtak et al. 2023). The obtained results, however, depend strongly on the adopted assumptions, in particular the prior probability distributions of SN intrinsic colours and host-galaxy reddening.
Virtually all models of type Ia SN colours (at a fixed phase of light curves) assume a Gaussian prior for intrinsic colours and an exponential distribution for host-galaxy reddening. The former is not motivated by any generic outcome of type Ia SN simulations; rather, it is the most straightforward choice for a random variable with a measurable mean and scatter. The exponential prior for reddening was introduced in early modelling studies of type Ia SN data (Jha et al. 2007) as an approximation of SN host-galaxy reddening distributions obtained from simulating extinction in disc-like galaxies (Riello & Patat 2005; Hatano et al. 1998). However, the exponential model has never been compared quantitatively to the simulated reddening distributions in relation to the assumptions about the spatial density of dust and type Ia SNe. Furthermore, the model does not take into account the fact that about 30 per cent of type Ia SNe originate from early-type (ET) galaxies (Hakobyan et al. 2012; Pruzhinskaya et al. 2020) with very low or negligible interstellar extinction.
The combination of the Gaussian prior for SN intrinsic colours and the exponential prior for host-galaxy reddening seems to be sufficient to model characteristic fat-tailed distributions of SN apparent colours, which is amply visible in many independent SN samples (Ginolin et al. 2025; Brout & Scolnic 2021). However, this does not necessarily guarantee that the model is complete. Based on combined modelling of SN apparent colours and peak magnitudes, many studies find surprisingly low total-to-selective extinction coefficients with RV ≲ 2, either for entire SN samples (Kessler et al. 2009; Burns et al. 2014) or for SN population in massive host galaxies (Brout & Scolnic 2021; Popovic et al. 2023). These estimates are discrepant with independent and mutually consistent measurements of the extinction coefficient for the Milky Way (Schlafly et al. 2016; Fitzpatrick & Massa 2007; Legnardi et al. 2023) as well as other LT galaxies (Salim et al. 2018; Rino-Silvestre et al. 2025) and ET galaxies (Patil et al. 2007; Goudfrooij et al. 1994), all pointing to a rather narrow distribution of RV peaking at RV ≈ 3 and decaying fast towards RV ≈ 2. The most recent improvements in SN light curve modelling or additional constraints from infrared (IR) observations seem to partially alleviate but not eliminate this discrepancy (Thorp et al. 2021; Ward et al. 2023; Wojtak et al. 2023; Thorp et al. 2024). Although we cannot exclude the effect of some special local conditions as the cause of peculiar extinction properties derived from type Ia SN observations (see e.g. Goobar 2008), another possibility is that low extinction estimates arise as a bias due to inaccurate prior distributions assumed for SN intrinsic colours or host-galaxy reddening. The unresolved problem of low extinction estimates derived from type Ia SN observations affects current cosmological measurements, including the local Hubble constant determination (Wojtak & Hjorth 2024).
The exponential prior for host-galaxy reddening can be thought of as the most likely model for a positively defined variable given solely its mean value. Its two-parameter generalisation given by the γ-distribution was recently tested against SN data. The model allows to constrain deviation of the actual probability distribution from the exponential distribution at small reddening. Based on Bayesian hierarchical modelling of SN light curve parameters, Wojtak et al. (2023) found a preference for distributions assigning maximum probability to sight lines with non-zero reddening. On the other hand, hierarchical Bayesian modelling of SN light curves showed that a similar trend occurs when highly reddened SNe are excluded, while fitting SN data without any cuts in SN colour favours distributions which are more peaked for reddening-free sight lines than the exponential model (Ward et al. 2023). These results put into question whether it is justified to use a prior reddening distribution that is universal across SN host-galaxy properties (see also Holwerda et al. 2015b,a) and the related SN populations. We must also consider whether the commonly used exponential model is accurate enough to model extinction corrections in type Ia SN host galaxies.
The goal of this paper is to compare the reddening distributions simulated across SN host-galaxy morphological types and to quantitatively test the accuracy of the exponential model. In contrast to previous studies employing arbitrary scales of dust column densities (and, thus, the interstellar reddening Riello & Patat 2005; Hatano et al. 1998), we computed the absolute scales directly from the expected dust masses based on measurements derived from Herschel IR observations (Smith et al. 2012; Cortese et al. 2012). We also incorporated a wide range of updates on the spatial distribution of dust and scaling relations between the dust and stellar disc parameters. These were obtained from studies of dust emission exploiting comprehensive observational data from the DustPedia database (Davies et al. 2017).
The outline of the paper is as follows. In Section 2 we describe the simulations and the observational foundation for the adopted assumptions about the spatial distribution of dust and type Ia SNe across SN host-galaxy morphological types. The results of the simulations, as well as the quantitative comparison between the simulated distributions and the exponential model are presented in Section 3. In Section 4, we discuss our results and draw implications for possible improvements to the modelling procedures for type Ia SN colours and host-galaxy extinction.
2. Simulations
We simulated the SN host-galaxy reddening using a Monte Carlo method based on sampling SN positions in host galaxies and computing dust column density, σdust, along random sight lines. The reddening E(B − V) is derived from the extinction AV in the V-band, computed as
![Mathematical equation: $$ \begin{aligned} A_{\rm V}=[(A_{\rm V}/N_{\rm H})(M_{\rm H}/M_{\rm dust})/m_{\rm H}]\sigma _{\rm dust}, \end{aligned} $$](/articles/aa/full_html/2026/02/aa55686-25/aa55686-25-eq1.gif) (1)
(1)
where AV/NH is the extinction per unit column density of hydrogen, which depends on the microscopic model of dust composition, MH/Mdust is the gas-to-dust mass ratio, and mH is the atomic mass of hydrogen. We assumed a Milky Way (MW) dust composition based on the model developed by Weingartner & Draine (2001), for which AV/NH = 5.3 × 10⁻²² mag cm−2 H−1 and RV = AV/E(B − V) = 3.1 (Draine et al. 2007). We adopted a gas-to-dust mass ratio of MH/Mdust = 102, which is a typical value measured across all galaxy morphological types (Casasola et al. 2020).
We considered four broad classes of host-galaxy morphological types, which differ in terms of the underlying spatial distributions of both SNe and dust. We assumed that type Ia SNe trace the stellar mass. This assumption is supported by a number of studies showing that type Ia SN positions that are most closely associated with the host-galaxy light distribution in the optical bands (Anderson et al. 2015; Pritchet et al. 2024). The scale parameters of the stellar and dust distributions are given by observational scaling relations, as described in detail below for each host-galaxy morphological type. Tables 1–2 provide a concise overview of all parameters and the underlying scaling relations, respectively, for LT (including transitional lenticular S0-type) and ET SN host galaxies. The galaxy models were computed assuming fixed stellar masses representing typical SN host galaxies: 1010 M⊙ for LT galaxies and 1010.5 M⊙ for S0 and elliptical galaxies. We generated 5 × 10⁴ random realisations of type Ia SN positions per host and 20 random sight lines per SN.
Parameters used in dust and type Ia SNe distribution simulations in a typical LT or S0-type galaxy.
Parameters in distribution simulations for dust and type Ia SNe in a typical elliptical galaxy.
As a more exploratory part of our study, we considered the possible impact of environmental differences between prompt (following a star formation history with typical delays of 0.1–0.5 Gyr) and delayed (exploding ≳0.5 Gyr after star formation) populations of type Ia SNe (Mannucci et al. 2005; Scannapieco & Bildsten 2005; Maoz et al. 2012). In this scenario, we might expect that the two SN populations have different spatial distributions due to the fact that prompt SNe are more associated with star-forming regions, while delayed SNe are more associated with old stellar environments. The difference might be primarily visible in the extent of SN vertical positions, where a narrower range is expected for the prompt population. Tentative evidence of this effect was reported in an analysis of type Ia SN positions in edge-on galaxies (Barkhudaryan 2023). Furthermore, we explore the impact of SN vertical positions on the reddening distribution in Section 3.1.
2.1. Late-type galaxies
We modelled the SN distribution as the sum of disc and bulge components. We assumed an exponential disc model with the density distribution given by
 (2)
(2)
where (R, z) are the radius and height in cylindrical coordinates, while RIa and hIa are the radial and vertical disc scales. We modelled the bulge component using the Sérsic model (Sérsic 1963; Sersic 1968), for which the surface density is
![Mathematical equation: $$ \begin{aligned} \Sigma _{\rm bulge,Ia}\propto \exp \Big [-b_{\rm n}\Big (\frac{R_{\rm p}}{R_{\rm e,Ia}}\Big )^{1/n}\Big ], \end{aligned} $$](/articles/aa/full_html/2026/02/aa55686-25/aa55686-25-eq3.gif) (3)
(3)
where Rp is the projected radius, Re, Ia is the effective radius defined as the radius of the aperture containing a half of the projected cumulative distribution, n is the Sérsic index, and bn is a fixed function of n derived from the definition of Re. To model the spatial distributions, we used an analytic approximation to the 3D deprojected density profile from Prugniel & Simien (1997). The relative rates of type Ia SNe originating from the bulge and disc component were assumed to be equal to the corresponding bulge-to-disc stellar mass ratio. We considered two cases of bulge-to-total mass ratios with Mb, ★/M★ = [0, 0.3], hereafter referred to as B/T. The adopted values span a range that includes the majority of B/T ratios measured from observations (Weinzirl et al. 2009; Laurikainen et al. 2007; Pastrav 2021). We assumed a pseudo-bulge with n = 2 as a typical Sérsic index measured in galaxies of late or transitional morphological types (Laurikainen et al. 2007).
We derived the optical radius R25 (the radius where the optical brightness in B-band is 25 mag arcsec−2) from the assumed stellar mass using an empirical scaling relation derived from observations from the Sloan Digital Sky Survey Data Release 15 (SDSS DR15) MaNGA survey (Bundy et al. 2015; Pilyugin et al. 2021). The optical radius was then used to estimate the scale parameters of the SN disc adopting respectively R★/R25 from Casasola et al. (2017) and hIa/R25 measured directly from type Ia SN vertical positions in edge-on galaxies (Hakobyan et al. 2017). The effective radius was given by the ratio Re/R★ = 0.2 determined from fitting the bulge and disc components to the light distribution in galaxies of different morphological types (Laurikainen et al. 2010; Graham & Worley 2008).
For the interstellar dust distribution, we assumed an exponential disc model, namely,
 (4)
(4)
where ρ0 is a normalisation term derived from the total dust mass. We computed the total dust mass using the dust-to-stellar mass ratio log10(Md/M★) = − 3.1, which is an average value measured in LT galaxies with stellar masses of 1010 M⊙ (Cortese et al. 2012). The dust disc is assumed to be 1.8 times thinner than the stellar disc (i.e. h★/hd ≈ hIa/hd = 1.8) and its scale length is 1.4 times larger than the corresponding length of the stellar disc, as measured from observations of edge-on LT galaxies (Xilouris et al. 1999; Galliano et al. 2018). The obtained spatial scales of the dust disc are consistent with independent estimates derived from observational scaling relations involving the dust mass (Mosenkov et al. 2022). As suggested by observations, we assume that the dust disc extends twice as far as the light (Smith et al. 2016), where the maximum radius for the latter is given by the standard optical radius R25. We also truncate the dust distribution at 6hd height above the disc plane.
2.2. Lenticular galaxy (S0)
We model S0-type galaxy as a transitional class between disc- and bulge-dominated galaxies. We use the above-described model devised for LT galaxy with the bulge-to-total mass ratio B/T = 0.5, which is typical value measured in lenticular galaxies (Weinzirl et al. 2009; Laurikainen et al. 2007; Pastrav 2021) and stellar mass M★ = 1010.5 M⊙. Based on observational constraints, we assume that the total dust-to-stellar mass ratio is log10(Md/M★) = − 4.4 (Smith et al. 2012; di Serego Alighieri et al. 2013), which is 1.3 dex lower than the corresponding ratio for LT galaxies.
2.3. Elliptical galaxy
As in other cases, we assume that type Ia SNe trace the stellar distribution. We modelled the stellar distribution in elliptical galaxies using the Sérsic model with n = 4. The effective radius of the Sérsic model is derived from the observational scaling relation based on the stellar mass (Hyde & Bernardi 2009). We adopted 1010.5 M⊙ as a representative stellar mass for this class of galaxies. We truncated the SN distribution at 8Re.
We computed the total dust mass using an average dust-to-stellar mass ratio log10(Md/M★) = − 5.8 measured in elliptical galaxies (Smith et al. 2012; di Serego Alighieri et al. 2013). The actual ratios can be higher than the adopted average due to evolutionary effects. Observations show that the dust content in ET galaxies undergoes evolution driven by dust destruction processes (Michałowski et al. 2019; Leśniewska et al. 2023). Consequently, the dust-to-stellar mass ratio tends to be higher in dynamically younger galaxies. The highest dust-to-stellar mass ratios are comparable to those in LT galaxies, namely, log10(Md/M★) = − 3, and they are found in about 5–10 per cent of ET galaxies (Rowlands et al. 2012; Leśniewska et al. 2023). In Section 4, we discuss implications of a scenario in which all ET host galaxies of type Ia SNe are maximally rich in dust.
Interstellar dust in ET galaxies may exhibit complex spatial distributions with features often visible in optical light, such as lanes and patches. However, the majority of dust observed in IR is thought to occur as a diffuse interstellar component (Goudfrooij & de Jong 1995). Given that IR observations provide rather poor constraints on its spatial distribution, we assume that the interstellar dust traces the stellar mass.
3. Results
3.1. Reddening for different layers of dust disc
The reddening distribution depends both on the spatial distribution of dust and SNe. The result of modelling is particularly sensitive to possible differences between the two distributions. Before we can consider the distributions resulting from averaging over SN positions in the host galaxy, it is instructive to begin by computing the expected reddening for several characteristic locations in the host galaxy. Here, we used the model of a disc-dominated galaxy (B/T = 0) from Table 1.
Figure 1 shows the expected reddening distribution for objects originating from nine fixed positions in the dust disc. The positions are given by a grid with (cylindrical) radial coordinates R = {0, Rd, 2Rd} and disc heights z = {0, hd, 3hd}, while the reddening distributions are generated for random sight lines. Comparing different panels of Figure 1 we can see that the reddening distribution depends strongly on the place of SN origin. For all locations above the disc plane, the distributions exhibit a bimodality which results from asymmetry of SN-disc orientations with respect to an observer. The distribution peaks become gradually more asymmetric at larger heights above the disc plane, where a smaller fraction of random sight lines can cross the dust disc and contribute to one of the distribution’s peaks. The distributions are unimodal for SNe located well within the dust disc at heights z < hd. In these cases, the reddening distributions reach maximum at E(B − V) > 0 and vanish at E(B − V) = 0.
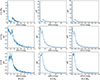 |
Fig. 1. Distributions of host-galaxy interstellar reddening E(B − V) for type Ia SNe originating from nine specific locations within the dust disc of a disc-dominated (B/T = 0) LT galaxy. The locations are distributed on a grid with (cylindrical) radii R running across the columns and disc heights z across the rows. Galaxy-observer orientations are assumed to be random and the parameters of the dust disc are listed in Table 1. Due to an asymmetry between disc-SN-observer and SN-disc-observer orientations, the local distributions are bimodal for layers above the disc plane. The reddening distributions peak at E(B − V) > 0 and vanish at E(B − V) = 0 for z ≲ hd. |
Figure 2 shows the effect of averaging the local distributions shown in Figure 1 over SN radial positions. The panels show the reddening distributions for different disc orientations with respect to an observer. It is apparent that averaging over SN radial positions erase bimodal features in the local distributions shown in Figure 2. For SNe originating from layers well within the dust disc (z ≲ hd), the reddening distributions persist to peak at E(B − V) > 0. The distributions become monotonically decreasing functions (maximum at E(B − V) = 0) as soon as the SN vertical position are comparable to the stellar disc scalelength h★ ≈ hIa ≈ 2hd. This transition appears to be the most pronounced for face-on configurations.
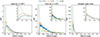 |
Fig. 2. Distributions of host interstellar reddening E(B − V) for type Ia SNe originating from different layers in the dust disc of a LT (B/T = 0) galaxy, with vertical positions z = {0, hd, 2hd}. The distributions are computed for edge-on (left panel), face-on (middle panel) and random (right panel) orientations of the galaxy disc with respect to an observer. The parameters of the dust disc are summarised in Table 1. The results demonstrate that the distribution peak (the most probable reddening) depends strongly on the SN’s vertical position in the disc; the distributions are unimodal with maximum at E(B − V) > 0 for z ≲ hd and monotonically decreasing, with maximum at E(B − V) = 0 for z > hd. |
The distributions shown in Figure 2 may have relevance for modelling type Ia SN observations. Although vertical positions within the stellar disc cannot be measured directly (unless the host galaxy is observed edge-on), we could expect a vertical stratification dictated by the progenitor age. Type Ia SNe with short or long delay times are expected to trace star formation regions or the old stellar population, respectively (Mannucci et al. 2005; Scannapieco & Bildsten 2005). The resulting SN populations would naturally exhibit different degrees of embedment in the dust disc (with the young population found preferentially in deeper layers of the dust disc) and, thus, different distributions of interstellar reddening.
3.2. Reddening in late-type galaxies
Figure 3 shows the reddening distribution resulting from averaging over the various SN positions in our model of LT host galaxy (B/T = 0 or B/T = 0.3). It is apparent that the distribution tail depends strongly on the galaxy inclination. For face-on galaxies (i < 20°), the distributions appear to be cut off at E(B − V)≈0.3 mag, which marks the maximum dust column density expected for R ≪ Rd and z ≪ hd. On the other hand, the distributions for edge-on orientations (i > 80°) exhibit long tails with reddening reaching E(B − V)≳1 mag corresponding to SNe that are well embedded within the dust disc. The distributions converge to an exponentially decaying probability density at E(B − V)≳0.1 mag. Averaging over random sight lines results in distributions for which exponential dependence on E(B − V) can be extended to a wider range of values. However, a clear deviation from the exponential distribution can be seen for the smallest (and most probable) reddening. Here, the simulations predict a higher probability of incidents with zero interstellar reddening than the exponential model.
As shown in Figure 3, the effect of bulge on the reddening distributions is noticeable, but relatively small. The SNe originating from the bulge component have more elevated positions than those in the stellar disc, but relatively shorter distances from the vertical centre axis perpendicular to the disc plane. This explains the enhanced probability of high (E(B − V)≳0.2 mag) and low (E(B − V)≈0) reddening for face-on galaxies. A more frequent occurrence of higher reddening is also visible for edge-on galaxies. This could be linked to a higher concentration of SNe with vertical positions coinciding with the disc plane.
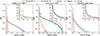 |
Fig. 3. Distributions of host-galaxy interstellar reddening E(B − V) for type Ia SNe originating from host galaxies of four representative morphological types: LT with B/T = 0 or B/T = 0.3, as well as S0 type and classical elliptical (for the model parameters, see Tables 1–2). The distributions are computed for edge-on (left panel), face-on (middle panel), and random (right panel) orientations (no difference for elliptical galaxies which are assumed to be spherically symmetric). The purple curve on the right panel shows the result of averaging type Ia SN rates over host-galaxy morphological types. All distributions peak at E(B − V)≈0. The apparent differences between the late- and ET host galaxies are primarily driven by different dust-to-stellar mass ratios measured from IR observations. The distributions shown in Figure 2 are strongly modified by averaging over the SN position in the host galaxy. |
The apparent differences between purely disc-shaped and bulged galaxies depend quite strongly on the effective radius of the bulge relative to the stellar disc radial and vertical scale. The bulge effective radius adopted in our simulations and based on observational properties of disc-like galaxies is about five times smaller than the stellar disc scalelength and comparable to its scale height. We can imagine that modifying the proportions between the scales of the bulge and the stellar disc might substantially change our results. For example, it is possible to increase the probability of sight lines with zero dust column densities (E(B − V)≈0) without any limit by increasing the bulge effective radius and the bulge-to-disc ratio of SN rates. However, the resulting galaxy models would eventually involve unrealistic bulges which are not represented in observations.
Summary statistics for interstellar host-galaxy reddening E(B − V) obtained from simulating dust columns densities in random sight lines to type Ia SNe.
Table 3 provides summary statistics for the simulated reddening distributions in randomly distributed sight lines. We also computed the analogous summary statistics for two fixed projected radii Rp = {0, 0.5R25} and we show the corresponding distributions in Figure 4. This is motivated by observations displaying different degrees of scatter in SN Hubble residuals across the projected distance from the host galaxy centre (Uddin et al. 2024; Toy et al. 2025). These observations are typically interpreted as an effect of differences between the reddening distribution in the inner and outer parts of SN host galaxies. Figure 4 confirms this scenario.
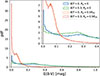 |
Fig. 4. Distributions of host-galaxy interstellar reddening E(B − V) for type Ia SNe at two different projected distances from the centre of a LT (B/T = 0 or B/T = 0.3) host galaxy: Rp = 0 and Rp = 0.5R25. The figure demonstrates a strong dependence of the conditional reddening on SN location in the host galaxy. |
Although our simulations were obtained for a fixed stellar mass, the expected reddening can be estimated using the assumed scaling relations between scale parameters of the discs and R25. Observationally motivated scalability of the dust and stellar disc sizes with R25 implies that reddening E(B − V) expected at any stellar mass can be derived from the following relation,
 (5)
(5)
where we assume  derived from observations (Pilyugin et al. 2021) and
  approximating the dust-to-stellar mass ratios measured as a function of the stellar mass (Cortese et al. 2012). The relation can be applied to any E(B − V) estimate, including percentiles or moments of the simulated distributions. For 1011 M⊙ and 109 M⊙ as the upper and lower stellar mass limits for type Ia SN host galaxies, the difference in reddening is about 0.4 dex. This is comparable to the expected scatter of 0.5 dex driven by the scatter in the observed dust-stellar mass relations (Cortese et al. 2012).
3.3. Reddening across morphological types
Figure 3 compares the reddening distributions simulated for four morphological types of SN host galaxies. The scale of simulated interstellar reddening spans two orders of magnitude, with mean reddening of 0.15 mag in LT galaxies, 0.02 mag in S0-type hosts, and 0.002 mag in ellipticals, (with ‘E’ denoting ellipticals; also see Table 3 for the complete summary statistics). This is primarily driven by a large dynamic range of dust-to-stellar mass ratios across galaxy morphological types. The assumed dust and SN spatial distributions have mainly impact on the distribution shape. Figure 3 shows that the reddening distribution obtained for elliptical galaxies exhibits the fastest growth at small reddening.
Since many observational estimates of interstellar reddening in SN host galaxies are derived probabilistically from entire samples without distinction between SN host-galaxy types, it is instructive to compute the expected distribution reflecting the actual SN rates across galaxy morphological types. Based on morphological type estimates from HyperLeda1 (Makarov et al. 2014) obtained for host galaxies of type Ia SNe from the SuperCal compilation (Scolnic et al. 2015) at redshifts of z < 0.15, we found 25 per cent of the SNe in elliptical galaxies (morphological types, as introduced by de Vaucouleurs 1974, t ∈ [ − 5, −3]), 25 per cent in S0-type galaxies (t ∈ ( − 3, 1]), and 50 per cent in LT galaxies (t ∈ (1, 7]). These results are in fair agreement with other available studies (see e.g. Pruzhinskaya et al. 2020). For the LT galaxies, we assumed an equal split between bulged and disc-dominated galaxies. Using these fractions as the weights for sampling SNe across our host-galaxy models, we obtained the distribution that shows our predictions marginalised over SN host-galaxy morphological types. Figure 3 shows the resulting distribution and the last column of Table 3 lists the quantiles. The obtained average distribution represents low-redshift observations. It is expected to be modified at high redshifts due to evolutionary processes changing the relative fractions of host-galaxy morphological types and the dust content.
3.4. Exponential model
Figure 3 shows that an exponential dependence of the simulated distributions on reddening is only approximate. In order to quantify the accuracy of the exponential model in reproducing the simulated data, we compare the cumulative distributions of the model and the simulated host-galaxy reddening. The model is given by
 (6)
(6)
where the scale parameter τ is by construction equal to the mean reddening ⟨E(B − V)⟩, which was computed directly from the simulated data. The results are shown in Figure 5 for all four morphological types considered in our study and for three cases of host-galaxy orientations (top panels). In the lower panels, we also show an analogous test for SNe originating from the z = 0 plane of the dust disc in LT galaxies.
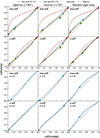 |
Fig. 5. Comparison between the cumulative distribution of simulated host-galaxy reddening E(B − V) (y-axis) and its approximation (x-axis) given by the best-fit exponential (exp-pdf) or γ-distribution (γ-pdf) model. Each panel in the upper half shows results for four morphological types of simulated host galaxies: LT (with B/T = 0 and B/T = 0.3), S0 type and ET. The columns show three cases of different galaxy-observer orientations: edge-on (left), face-on (middle), and random (right). The bottom panels show analogous comparison for SNe originating from the z = 0 plane of the dust disc in the LT host-galaxy model (B/T = 0). The symbols denote two characteristic scales of reddening with E(B − V) = 0.01 mag (•) and E(B − V) = 0.1 mag (▴), as given by the simulated distributions. The exponential model underestimates the probability of zero reddening, especially in the ET host galaxies. The simulated data are better reproduced by the γ-distribution. For type Ia SNe originating from the proximity of the z = 0 disc plane, the exponential model overpredicts the SN rate with E(B − V)≈0. |
Figure 5 demonstrates that the simulated distributions depart from their exponential approximations. In general, the simulations generate a higher fraction of sight lines with zero reddening (E(B − V)≈0) with respect to the exponential model. This property is particularly visible for ET galaxies, but it is more subtle for LT galaxies. We find that a better match to the simulated distributions can be obtained using the γ-distribution given by
 (7)
(7)
which is the simplest generalisation of the exponential model (recovered for γ = 1), where Γ(γ) is the gamma function. Fitting the model to the simulated reddening we find strong evidence for γ < 1 for all host-galaxy morphological types. This signifies more pronounced peaks for the distributions at E(B − V)≈0 than with the exponential model with the same scale parameter. The lowest value of γ is obtained for the elliptical host galaxy. The best-fit values are listed in Table 3.
Population of type Ia SNe originating from the z = 0 plane (which can be thought of as a close tracer of prompt SNe) exhibits a different pattern of differences with respect to the approximating exponential model. Here, the exponential model overpredicts the SN rate with E(B − V)≈0 and underpredicts those with large reddening. We find that the simulated data are mildly better approximated by the γ-distribution model with γ ≳ 1 (see Table 3).
3.5. Supernova colour distribution
The main observational manifestation of dust reddening lies in long tails of the observed SN colour distributions at red colours. Here, we use measurements of the apparent B–V colour (at the peak of the B-band light curve) given by the colour parameter c of the SALT light curve fitter (Guy et al. 2005) to obtain constraints on free parameters of the expected reddening distribution given by Eq. (7) and compare them to the predictions of the dust model. We modelled the observed colour as the sum of a priori unknown time-independent component of intrinsic colour, cint, and reddening, E(B − V), namely,
 (8)
(8)
We used a colour parameter measurements from the volume-limited (z < 0.06) sample of normal type Ia from the Zwicky Transient Factory (ZTF) DR2 (Rigault et al. 2025). We included SNe with the recommended high-quality fits given by a set of criteria outlined in Rigault et al. (2025). We split the sample into three groups of host-galaxy morphological types corresponding to the three morphological classes adopted for our dust modelling. We used a continuous morphological type t introduced by de Vaucouleurs (1974) and its estimates from the HyperLeda database (Makarov et al. 2014)2. With the morphological type estimates available for 38 per cent of the SN host galaxies, we found 74 SNe in elliptical (t ∈ [ − 5, −3]), 73 in S0-type (t ∈ ( − 3, 1]) and 153 LT (t ∈ (1, 7]) galaxies. Figure 6 shows the distribution of SN colour parameter, c, in the three groups of host-galaxy morphological types. The mean logarithmic stellar masses computed from the ZTF host-galaxy data are: 10.21 (LT), 10.51 (S0 type), and 10.50 (ET). They match closely the fiducial stellar masses assumed in our dust model.
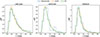 |
Fig. 6. Distribution of type Ia SN colour parameter c in LT (left panel), S0-type (middle panel), and elliptical (right panel) galaxies. The coarse-bin histogram show the measurements from the ZTF volume-limited sample of normal type Ia SNe and fine-bin histograms are best-fit models assuming a Gaussian prior distribution for intrinsic colours and a γ-distribution (or exponential) model for reddening E(B − V). |
We fit the distribution of the SN colour parameter assuming a model given by a convolution of a Gaussian prior distribution for cint with the prior reddening distribution given by Eq. (7) and a zero-mean Gaussian accounting for measurement uncertainty per SN. Although the Gaussianity of the intrinsic colour distribution is commonly taken for granted, this assumption has never been verified on theoretical and observational grounds, making it the main source of potential systematic errors in derived properties of the reddening distribution.
Figure 7 shows constraints on free parameters of the prior reddening distribution obtained in each host-galaxy morphological class assuming independent prior distributions of the intrinsic colours. The credibility contours were obtained by integrating the posterior probability distributions using a Markov chain Monte Carlo method implemented in the emcee code (Foreman-Mackey et al. 2013). The adopted likelihood was given by the product of the model distribution evaluated at SN colour parameter measurements. The best-fit model distributions of the SN colour parameter are compared to the data in Figure 6. The distributions are computed by means of sampling from the prior distributions with best-fit hyperparameters and from the actual distribution of measurement uncertainties.
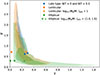 |
Fig. 7. Parameters of the reddening distribution (see Eq. (7)) obtained from fitting the observed SN colours conditioned on the Gaussianity of the intrinsic colour distribution. The results shown as 68 and 95 per cent credibility contours are compared to the predictions of the dust model from this study. The apparent discrepancy between the observational constraints and the dust model for ET host galaxies implies that either the observed red colours are primarily driven by a larger variation in SN intrinsic colours or ET host galaxies are unusually rich in interstellar dust. The square and triangle symbols show the effect of increasing the dust-to-stellar mass ratio by 1.0 dex and 1.5 dex. |
As shown in Figure 7, we find only a mild ∼2σ difference between the observationally constrained reddening distribution and the dust model for LT host galaxies. On the other hand, the observations point to a significantly larger scale parameter of the reddening distribution in ET galaxies than the prediction of our dust model. This implies that the apparent excess of red SNe in ET host galaxies (c ≳ 0.2 mag in Figure 6) cannot be explained by reddening based on a typical interstellar dust content in these types of host galaxies. There are two possible solutions to this discrepancy. The first possibility is to assume that the excess of apparent red colours is driven by the variation in intrinsic colours. In this scenario, the distribution of intrinsic colours is not Gaussian and it exhibits a longer tail at red colours. Another possibility is to assume that ET host galaxies are richer in dust than average dust-to-stellar mass ratios. As shown in Figure 7, this would require a 1.5 dex (1.0 dex) larger dust-to-stellar mass ratios for elliptical (S0-type) galaxies. These relatively high dust-to-stellar mass ratio are observed only in a fraction of ET galaxies.
4. Discussion
Deriving cosmological distances from type Ia SN observations depend on model-dependent extinction corrections conditioned on apparent SN colours. The standard assumption used commonly for modelling type Ia SN colours is that the host-galaxy reddening distribution is universal across host-galaxy morphological types and well approximated by the exponential model. However, this cannot be reconciled with the results presented in our study. Firstly, our simulations of host-galaxy reddening demonstrate substantial differences between the interstellar reddening distributions across host-galaxy morphological types. Secondly, the simulated distributions deviate from the exponential model and predict a more frequent occurrence of sight lines with zero reddening than the corresponding best-fit exponential models. The departure from the exponential model appears to be particularly strong for ET host galaxies and less prominent for LT host galaxies. We find that the simulated reddening distributions are better reproduced by a γ-distribution with γ < 1. The model predicts higher probability at E(B − V) = 0 than the corresponding exponential distribution for which γ = 1. Similar values of the shape parameter γ were found by Ward et al. (2023) for a SN sample, including all highly reddened SNe.
The obtained mean reddening for LT galaxies, namely, ⟨E(B − V)⟩ = 0.15 mag, agrees very well with observational constraints from modelling SN colours, ranging between ⟨E(B − V)⟩ ≈ 0.1 mag and ⟨E(B − V)⟩ ≈ 0.15 mag (see e.g. Brout & Scolnic 2021; Ginolin et al. 2025; Wojtak et al. 2023; Ward et al. 2023). We also predicted a similar rate of the most reddened SNe: 5 per cent of the most reddened SNe in our simulations have E(B − V) > 0.5 mag, while observations yield E(B − V)≳0.4 mag based on redshift z < 0.2 SNe from the Pantheon+ compilation without any cuts in colour (Rose et al. 2022) and assuming mean intrinsic colour of −0.08 mag (Popovic et al. 2023).
Our results suggest that the interstellar reddening in ET galaxies should not exceed E(B − V)≈0.05 mag due to a substantially lower dust-to-stellar-mass ratio found on average in these galaxies. This appears to disagree with the fact that the observed SN colours do not show a clear suppression of the red tail for ET host galaxies (Ginolin et al. 2025; Larison et al. 2024). In fact, Ginolin et al. (2025) found only 0.06 mag difference between the mean reddening in SN host galaxies rich in dust and those selected as dustless. This apparent discrepancy between the expected and observationally estimated reddening in ET galaxies (shown explicitly in Figure 7) can be solved by assuming that elliptical galaxies producing type Ia SN are not typical and they are as rich in dust as LT counterparts. The challenge here is that only about 5–10 per cent of ET galaxies have dust masses comparable to LT analogues (Rowlands et al. 2012; Leśniewska et al. 2023). Another option is that the observed red colours of type Ia SNe originating from ET galaxies (or low-stretch SNe) are not due to host-galaxy interstellar reddening but to a larger extent due to variation in intrinsic colours (see also Burns et al. 2014; González-Gaitán et al. 2011). This scenario can potentially help alleviate the problem of oddly low estimates of the total-to-selective extinction coefficients with RB ≈ 3 (for a compilation of measurements from the literature see Thorp et al. 2024). These estimates are typically obtained for low-stretch type Ia SNe (Wojtak & Hjorth 2025) or SNe originating from massive galaxies (Brout & Scolnic 2021), where the fits are strongly driven by SN originating from elliptical galaxies. Their values coincide closely with the coefficient quantifying the dependence of SN peak magnitude on its intrinsic colour (Brout & Scolnic 2021; Wojtak & Hjorth 2025). This coincidence suggests that what is modelled as two independent effects (host-galaxy reddening and SN intrinsic colours) can be primarily driven solely by the former, supporting the conjecture that highly reddened SN in ET host galaxies result from the variation in SN intrinsic colours. Further tests of this scenario should involve Bayesian hierarchical modelling with a wider range of possible prior distributions of intrinsic colours for SNe originating from ET galaxies.
The simulated reddening in LT host galaxies is quite sensitive to the distribution of SN vertical positions in the disc. For type Ia SNe that are more embedded in the dust disc, the reddening distributions tend to peak at non-zero values. This configuration may be preferred by a population of young type Ia SNe originating from star forming environments that are more correlated with the dust disc and less extended in vertical positions than the stellar disc. The young SN population is hypothesised as one of the two progenitor channels required to explain the observed distribution of delay times between the star formation and type Ia SN explosions (Mannucci et al. 2005; Scannapieco & Bildsten 2005). Relative excess of this population may be expected in galaxies with high recent star formation. Possible connection between recent star formation histories and the extent of SN vertical positions in the disc is a testable scenario, especially with large surveys such as the Large Synoptic Survey Telescope (LSST) of the Rubin Observatory (LSST Science Collaboration 2009). Interestingly, several recent analyses of type Ia SN data employing the γ-distribution, as a generalisation of the exponential model, for host-galaxy reddening show a preference for distributions peaking at non-zero E(B − V) expected for young SN populations (Wojtak et al. 2023; Ward et al. 2023).
Using type Ia SN host galaxy-dependent reddening prior is also relevant for deriving unbiased cosmological distances. This becomes particularly relevant when distance estimates are propagated between type Ia SNe originating from different samples of host galaxies. The determination of the Hubble constant based on distance calibration from Cepheids is a prime example: type Ia SNe from the Hubble flow originate from galaxies of mixed morphological types, whereas the calibration galaxies with observable Cepheids are exclusively LT galaxies. The leading Hubble constant measurement of this kind obtained by Riess et al. (2022) is based on the assumption that prior reddening distribution and derived extinction parameters are the same both in the calibration galaxies and the Hubble flow (Popovic et al. 2023; Brout & Scolnic 2021). Direct effect of assuming a reddening prior distribution that is shared across different morphological types of SN host galaxies is an underestimation of extinction corrections in the calibration of SNe (due to low effective extinction extrapolated from elliptical galaxies in the Hubble flow). This, in turn, results in an overestimation of the Hubble constant (Wojtak & Hjorth 2022, 2024, 2025). An effective way to avoid this kind of bias is to separate reddening priors for ET and LT host galaxies (Wojtak & Hjorth 2025) or to consider only one class of morphological types (Newman et al. 2025). Given the fact that the physical origin of reddened SNe in ET SN is yet to be understood, these strategies are necessary to follow to minimise systematic errors in the Hubble constant estimation.
Acknowledgments
This work was supported by research grants (VIL16599,VIL54489) from VILLUM FONDEN. RW thanks João Duarte and Santiago González-Gaitán for inspiring discussions and comments on the paper. The authors thank the anonymous referee for useful comments that helped improve this work.
References
- Adame, A. G., Aguilar, J., Ahlen, S., et al. 2025, JCAP, 2025, 021 [CrossRef] [Google Scholar]
- Anderson, J. P., James, P. A., Förster, F., et al. 2015, MNRAS, 448, 732 [NASA ADS] [CrossRef] [Google Scholar]
- Barkhudaryan, L. V. 2023, MNRAS, 520, L21 [Google Scholar]
- Brout, D., & Scolnic, D. 2021, ApJ, 909, 26 [NASA ADS] [CrossRef] [Google Scholar]
- Brout, D., Scolnic, D., Popovic, B., et al. 2022, ApJ, 938, 110 [NASA ADS] [CrossRef] [Google Scholar]
- Bundy, K., Bershady, M. A., Law, D. R., et al. 2015, ApJ, 798, 7 [Google Scholar]
- Burns, C. R., Stritzinger, M., Phillips, M. M., et al. 2014, ApJ, 789, 32 [Google Scholar]
- Casasola, V., Cassarà, L. P., Bianchi, S., et al. 2017, A&A, 605, A18 [NASA ADS] [CrossRef] [EDP Sciences] [Google Scholar]
- Casasola, V., Bianchi, S., De Vis, P., et al. 2020, A&A, 633, A100 [NASA ADS] [CrossRef] [EDP Sciences] [Google Scholar]
- Cortês, M., & Liddle, A. R. 2025, MNRAS, 544, L121 [Google Scholar]
- Cortese, L., Ciesla, L., Boselli, A., et al. 2012, A&A, 540, A52 [NASA ADS] [CrossRef] [EDP Sciences] [Google Scholar]
- Davies, J. I., Baes, M., Bianchi, S., et al. 2017, PASP, 129, 044102 [NASA ADS] [CrossRef] [Google Scholar]
- de Vaucouleurs, G. 1974, in The Formation and Dynamics of Galaxies, ed. J. R. Shakeshaft, IAU Symp., 58, 1 [Google Scholar]
- DES Collaboration (Abbott, T. M. C., et al.) 2024, ApJ, 973, L14 [NASA ADS] [CrossRef] [Google Scholar]
- Dhawan, S., Popovic, B., & Goobar, A. 2025, MNRAS, 540, 1626 [Google Scholar]
- di Serego Alighieri, S., Bianchi, S., Pappalardo, C., et al. 2013, A&A, 552, A8 [NASA ADS] [CrossRef] [EDP Sciences] [Google Scholar]
- Draine, B. T., Dale, D. A., Bendo, G., et al. 2007, ApJ, 663, 866 [NASA ADS] [CrossRef] [Google Scholar]
- Fitzpatrick, E. L., & Massa, D. 2007, ApJ, 663, 320 [Google Scholar]
- Foreman-Mackey, D., Hogg, D. W., Lang, D., & Goodman, J. 2013, PASP, 125, 306 [Google Scholar]
- Galliano, F., Galametz, M., & Jones, A. P. 2018, ARA&A, 56, 673 [Google Scholar]
- Ginolin, M., Rigault, M., Copin, Y., et al. 2025, A&A, 694, A4 [NASA ADS] [CrossRef] [EDP Sciences] [Google Scholar]
- González-Gaitán, S., Perrett, K., Sullivan, M., et al. 2011, ApJ, 727, 107 [Google Scholar]
- Goobar, A. 2008, ApJ, 686, L103 [CrossRef] [Google Scholar]
- Goudfrooij, P., & de Jong, T. 1995, A&A, 298, 784 [NASA ADS] [Google Scholar]
- Goudfrooij, P., de Jong, T., Hansen, L., & Norgaard-Nielsen, H. U. 1994, MNRAS, 271, 833 [Google Scholar]
- Graham, A. W., & Worley, C. C. 2008, MNRAS, 388, 1708 [NASA ADS] [CrossRef] [Google Scholar]
- Guy, J., Astier, P., Nobili, S., Regnault, N., & Pain, R. 2005, A&A, 443, 781 [NASA ADS] [CrossRef] [EDP Sciences] [Google Scholar]
- Hakobyan, A. A., Adibekyan, V. Z., Aramyan, L. S., et al. 2012, A&A, 544, A81 [NASA ADS] [CrossRef] [EDP Sciences] [Google Scholar]
- Hakobyan, A. A., Barkhudaryan, L. V., Karapetyan, A. G., et al. 2017, MNRAS, 471, 1390 [NASA ADS] [CrossRef] [Google Scholar]
- Hatano, K., Branch, D., & Deaton, J. 1998, ApJ, 502, 177 [Google Scholar]
- Holwerda, B. W., Keel, W. C., Kenworthy, M. A., & Mack, K. J. 2015a, MNRAS, 451, 2390 [Google Scholar]
- Holwerda, B. W., Reynolds, A., Smith, M., & Kraan-Korteweg, R. C. 2015b, MNRAS, 446, 3768 [NASA ADS] [CrossRef] [Google Scholar]
- Hyde, J. B., & Bernardi, M. 2009, MNRAS, 394, 1978 [NASA ADS] [CrossRef] [Google Scholar]
- Jha, S., Riess, A. G., & Kirshner, R. P. 2007, ApJ, 659, 122 [NASA ADS] [CrossRef] [Google Scholar]
- Kessler, R., Becker, A. C., Cinabro, D., et al. 2009, ApJS, 185, 32 [Google Scholar]
- Larison, C., Jha, S. W., Kwok, L. A., & Camacho-Neves, Y. 2024, ApJ, 961, 185 [NASA ADS] [CrossRef] [Google Scholar]
- Laurikainen, E., Salo, H., Buta, R., & Knapen, J. H. 2007, MNRAS, 381, 401 [Google Scholar]
- Laurikainen, E., Salo, H., Buta, R., Knapen, J. H., & Comerón, S. 2010, MNRAS, 405, 1089 [NASA ADS] [Google Scholar]
- Legnardi, M. V., Milone, A. P., Cordoni, G., et al. 2023, MNRAS, 522, 367 [CrossRef] [Google Scholar]
- Leśniewska, A., Michałowski, M. J., Gall, C., et al. 2023, ApJ, 953, 27 [CrossRef] [Google Scholar]
- LSST Science Collaboration (Abell, P. A., et al.) 2009, arXiv e-prints [arXiv:0912.0201] [Google Scholar]
- Makarov, D., Prugniel, P., Terekhova, N., Courtois, H., & Vauglin, I. 2014, A&A, 570, A13 [NASA ADS] [CrossRef] [EDP Sciences] [Google Scholar]
- Mandel, K. S., Narayan, G., & Kirshner, R. P. 2011, ApJ, 731, 120 [CrossRef] [Google Scholar]
- Mandel, K. S., Scolnic, D. M., Shariff, H., Foley, R. J., & Kirshner, R. P. 2017, ApJ, 842, 93 [NASA ADS] [CrossRef] [Google Scholar]
- Mandel, K. S., Thorp, S., Narayan, G., Friedman, A. S., & Avelino, A. 2022, MNRAS, 510, 3939 [NASA ADS] [CrossRef] [Google Scholar]
- Mannucci, F., Della Valle, M., Panagia, N., et al. 2005, A&A, 433, 807 [NASA ADS] [CrossRef] [EDP Sciences] [Google Scholar]
- Maoz, D., Mannucci, F., & Brandt, T. D. 2012, MNRAS, 426, 3282 [NASA ADS] [CrossRef] [Google Scholar]
- Michałowski, M. J., Hjorth, J., Gall, C., et al. 2019, A&A, 632, A43 [NASA ADS] [CrossRef] [EDP Sciences] [Google Scholar]
- Mosenkov, A. V., Usachev, P. A., Shakespear, Z., et al. 2022, MNRAS, 515, 5698 [NASA ADS] [CrossRef] [Google Scholar]
- Newman, M. J. B., Larison, C., Jha, S. W., et al. 2025, arXiv e-prints [arXiv:2508.20023] [Google Scholar]
- Pastrav, B. A. 2021, MNRAS, 506, 452 [Google Scholar]
- Patil, M. K., Pandey, S. K., Sahu, D. K., & Kembhavi, A. 2007, A&A, 461, 103 [NASA ADS] [CrossRef] [EDP Sciences] [Google Scholar]
- Perlmutter, S., Aldering, G., Goldhaber, G., et al. 1999, ApJ, 517, 565 [Google Scholar]
- Pilyugin, L. S., Zinchenko, I. A., Lara-López, M. A., Nefedyev, Y. A., & Vílchez, J. M. 2021, A&A, 646, A54 [NASA ADS] [CrossRef] [EDP Sciences] [Google Scholar]
- Popovic, B., Brout, D., Kessler, R., & Scolnic, D. 2023, ApJ, 945, 84 [NASA ADS] [CrossRef] [Google Scholar]
- Pritchet, C., Thanjavur, K., Bottrell, C., & Gao, Y. 2024, AJ, 167, 131 [Google Scholar]
- Prugniel, P., & Simien, F. 1997, A&A, 321, 111 [NASA ADS] [Google Scholar]
- Pruzhinskaya, M. V., Novinskaya, A. K., Pauna, N., & Rosnet, P. 2020, MNRAS, 499, 5121 [NASA ADS] [CrossRef] [Google Scholar]
- Riello, M., & Patat, F. 2005, MNRAS, 362, 671 [Google Scholar]
- Riess, A. G., Filippenko, A. V., Challis, P., et al. 1998, AJ, 116, 1009 [Google Scholar]
- Riess, A. G., Yuan, W., Macri, L. M., et al. 2022, ApJ, 934, L7 [NASA ADS] [CrossRef] [Google Scholar]
- Rigault, M., Smith, M., Goobar, A., et al. 2025, A&A, 694, A1 [NASA ADS] [CrossRef] [EDP Sciences] [Google Scholar]
- Rino-Silvestre, J., González-Gaitán, S., Mourão, A., Duarte, J., & Pereira, B. 2025, A&A, 703, A170 [NASA ADS] [CrossRef] [EDP Sciences] [Google Scholar]
- Rose, B. M., Popovic, B., Scolnic, D., & Brout, D. 2022, MNRAS, 516, 4822 [NASA ADS] [CrossRef] [Google Scholar]
- Rowlands, K., Dunne, L., Maddox, S., et al. 2012, MNRAS, 419, 2545 [NASA ADS] [CrossRef] [Google Scholar]
- Rubin, D., Aldering, G., Betoule, M., et al. 2025, ApJ, 986, 231 [Google Scholar]
- Salim, S., Boquien, M., & Lee, J. C. 2018, ApJ, 859, 11 [Google Scholar]
- Scannapieco, E., & Bildsten, L. 2005, ApJ, 629, L85 [Google Scholar]
- Schlafly, E. F., Meisner, A. M., Stutz, A. M., et al. 2016, ApJ, 821, 78 [NASA ADS] [CrossRef] [Google Scholar]
- Scolnic, D., Casertano, S., Riess, A., et al. 2015, ApJ, 815, 117 [Google Scholar]
- Sérsic, J. L. 1963, Boletin de la Asociacion Argentina de Astronomia La Plata Argentina, 6, 41 [Google Scholar]
- Sersic, J. L. 1968, Atlas de Galaxias Australes [Google Scholar]
- Smith, M. W. L., Gomez, H. L., Eales, S. A., et al. 2012, ApJ, 748, 123 [NASA ADS] [CrossRef] [Google Scholar]
- Smith, M. W. L., Eales, S. A., De Looze, I., et al. 2016, MNRAS, 462, 331 [NASA ADS] [CrossRef] [Google Scholar]
- Thorp, S., & Mandel, K. S. 2022, MNRAS, 517, 2360 [CrossRef] [Google Scholar]
- Thorp, S., Mandel, K. S., Jones, D. O., Ward, S. M., & Narayan, G. 2021, MNRAS, 508, 4310 [NASA ADS] [CrossRef] [Google Scholar]
- Thorp, S., Mandel, K. S., Jones, D. O., Kirshner, R. P., & Challis, P. M. 2024, MNRAS, 530, 4016 [NASA ADS] [CrossRef] [Google Scholar]
- Toy, M., Wiseman, P., Sullivan, M., et al. 2025, MNRAS, 538, 181 [Google Scholar]
- Uddin, S. A., Burns, C. R., Phillips, M. M., et al. 2024, ApJ, 970, 72 [Google Scholar]
- Ward, S. M., Dhawan, S., Mandel, K. S., Grayling, M., & Thorp, S. 2023, MNRAS, 526, 5715 [Google Scholar]
- Weingartner, J. C., & Draine, B. T. 2001, ApJ, 548, 296 [Google Scholar]
- Weinzirl, T., Jogee, S., Khochfar, S., Burkert, A., & Kormendy, J. 2009, ApJ, 696, 411 [NASA ADS] [CrossRef] [Google Scholar]
- Wojtak, R., & Hjorth, J. 2022, MNRAS, 515, 2790 [CrossRef] [Google Scholar]
- Wojtak, R., & Hjorth, J. 2024, MNRAS, 533, 2319 [Google Scholar]
- Wojtak, R., & Hjorth, J. 2025, A&A, 702, A176 [NASA ADS] [CrossRef] [EDP Sciences] [Google Scholar]
- Wojtak, R., Hjorth, J., & Hjortlund, J. O. 2023, MNRAS, 525, 5187 [NASA ADS] [CrossRef] [Google Scholar]
- Xilouris, E. M., Byun, Y. I., Kylafis, N. D., Paleologou, E. V., & Papamastorakis, J. 1999, A&A, 344, 868 [NASA ADS] [Google Scholar]
All Tables
Parameters used in dust and type Ia SNe distribution simulations in a typical LT or S0-type galaxy.
Parameters in distribution simulations for dust and type Ia SNe in a typical elliptical galaxy.
Summary statistics for interstellar host-galaxy reddening E(B − V) obtained from simulating dust columns densities in random sight lines to type Ia SNe.
All Figures
|
Fig. 1. Distributions of host-galaxy interstellar reddening E(B − V) for type Ia SNe originating from nine specific locations within the dust disc of a disc-dominated (B/T = 0) LT galaxy. The locations are distributed on a grid with (cylindrical) radii R running across the columns and disc heights z across the rows. Galaxy-observer orientations are assumed to be random and the parameters of the dust disc are listed in Table 1. Due to an asymmetry between disc-SN-observer and SN-disc-observer orientations, the local distributions are bimodal for layers above the disc plane. The reddening distributions peak at E(B − V) > 0 and vanish at E(B − V) = 0 for z ≲ hd. |
| In the text | |
|
Fig. 2. Distributions of host interstellar reddening E(B − V) for type Ia SNe originating from different layers in the dust disc of a LT (B/T = 0) galaxy, with vertical positions z = {0, hd, 2hd}. The distributions are computed for edge-on (left panel), face-on (middle panel) and random (right panel) orientations of the galaxy disc with respect to an observer. The parameters of the dust disc are summarised in Table 1. The results demonstrate that the distribution peak (the most probable reddening) depends strongly on the SN’s vertical position in the disc; the distributions are unimodal with maximum at E(B − V) > 0 for z ≲ hd and monotonically decreasing, with maximum at E(B − V) = 0 for z > hd. |
| In the text | |
|
Fig. 3. Distributions of host-galaxy interstellar reddening E(B − V) for type Ia SNe originating from host galaxies of four representative morphological types: LT with B/T = 0 or B/T = 0.3, as well as S0 type and classical elliptical (for the model parameters, see Tables 1–2). The distributions are computed for edge-on (left panel), face-on (middle panel), and random (right panel) orientations (no difference for elliptical galaxies which are assumed to be spherically symmetric). The purple curve on the right panel shows the result of averaging type Ia SN rates over host-galaxy morphological types. All distributions peak at E(B − V)≈0. The apparent differences between the late- and ET host galaxies are primarily driven by different dust-to-stellar mass ratios measured from IR observations. The distributions shown in Figure 2 are strongly modified by averaging over the SN position in the host galaxy. |
| In the text | |
|
Fig. 4. Distributions of host-galaxy interstellar reddening E(B − V) for type Ia SNe at two different projected distances from the centre of a LT (B/T = 0 or B/T = 0.3) host galaxy: Rp = 0 and Rp = 0.5R25. The figure demonstrates a strong dependence of the conditional reddening on SN location in the host galaxy. |
| In the text | |
|
Fig. 5. Comparison between the cumulative distribution of simulated host-galaxy reddening E(B − V) (y-axis) and its approximation (x-axis) given by the best-fit exponential (exp-pdf) or γ-distribution (γ-pdf) model. Each panel in the upper half shows results for four morphological types of simulated host galaxies: LT (with B/T = 0 and B/T = 0.3), S0 type and ET. The columns show three cases of different galaxy-observer orientations: edge-on (left), face-on (middle), and random (right). The bottom panels show analogous comparison for SNe originating from the z = 0 plane of the dust disc in the LT host-galaxy model (B/T = 0). The symbols denote two characteristic scales of reddening with E(B − V) = 0.01 mag (•) and E(B − V) = 0.1 mag (▴), as given by the simulated distributions. The exponential model underestimates the probability of zero reddening, especially in the ET host galaxies. The simulated data are better reproduced by the γ-distribution. For type Ia SNe originating from the proximity of the z = 0 disc plane, the exponential model overpredicts the SN rate with E(B − V)≈0. |
| In the text | |
|
Fig. 6. Distribution of type Ia SN colour parameter c in LT (left panel), S0-type (middle panel), and elliptical (right panel) galaxies. The coarse-bin histogram show the measurements from the ZTF volume-limited sample of normal type Ia SNe and fine-bin histograms are best-fit models assuming a Gaussian prior distribution for intrinsic colours and a γ-distribution (or exponential) model for reddening E(B − V). |
| In the text | |
|
Fig. 7. Parameters of the reddening distribution (see Eq. (7)) obtained from fitting the observed SN colours conditioned on the Gaussianity of the intrinsic colour distribution. The results shown as 68 and 95 per cent credibility contours are compared to the predictions of the dust model from this study. The apparent discrepancy between the observational constraints and the dust model for ET host galaxies implies that either the observed red colours are primarily driven by a larger variation in SN intrinsic colours or ET host galaxies are unusually rich in interstellar dust. The square and triangle symbols show the effect of increasing the dust-to-stellar mass ratio by 1.0 dex and 1.5 dex. |
| In the text | |
Current usage metrics show cumulative count of Article Views (full-text article views including HTML views, PDF and ePub downloads, according to the available data) and Abstracts Views on Vision4Press platform.
Data correspond to usage on the plateform after 2015. The current usage metrics is available 48-96 hours after online publication and is updated daily on week days.
Initial download of the metrics may take a while.