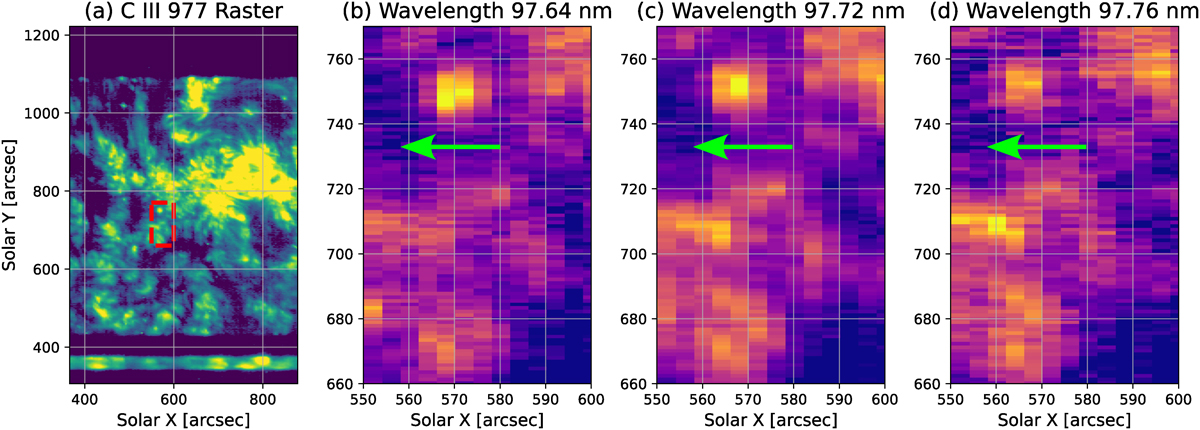
Fig. 3.
Download original image
Illustration of the x − λ and y − λ shifts in a slice of a SPICE spectral cube, with the intensity raster shown in the C III 977 Å line. Panels (b), (c), and (d) show zoomed-in slices (corresponding to the red square in panel (a)) where the x − y shift is apparent as a slight translation of the same features when scanning through consecutive wavelengths. Please see the online for an illustration of this effect.
Current usage metrics show cumulative count of Article Views (full-text article views including HTML views, PDF and ePub downloads, according to the available data) and Abstracts Views on Vision4Press platform.
Data correspond to usage on the plateform after 2015. The current usage metrics is available 48-96 hours after online publication and is updated daily on week days.
Initial download of the metrics may take a while.