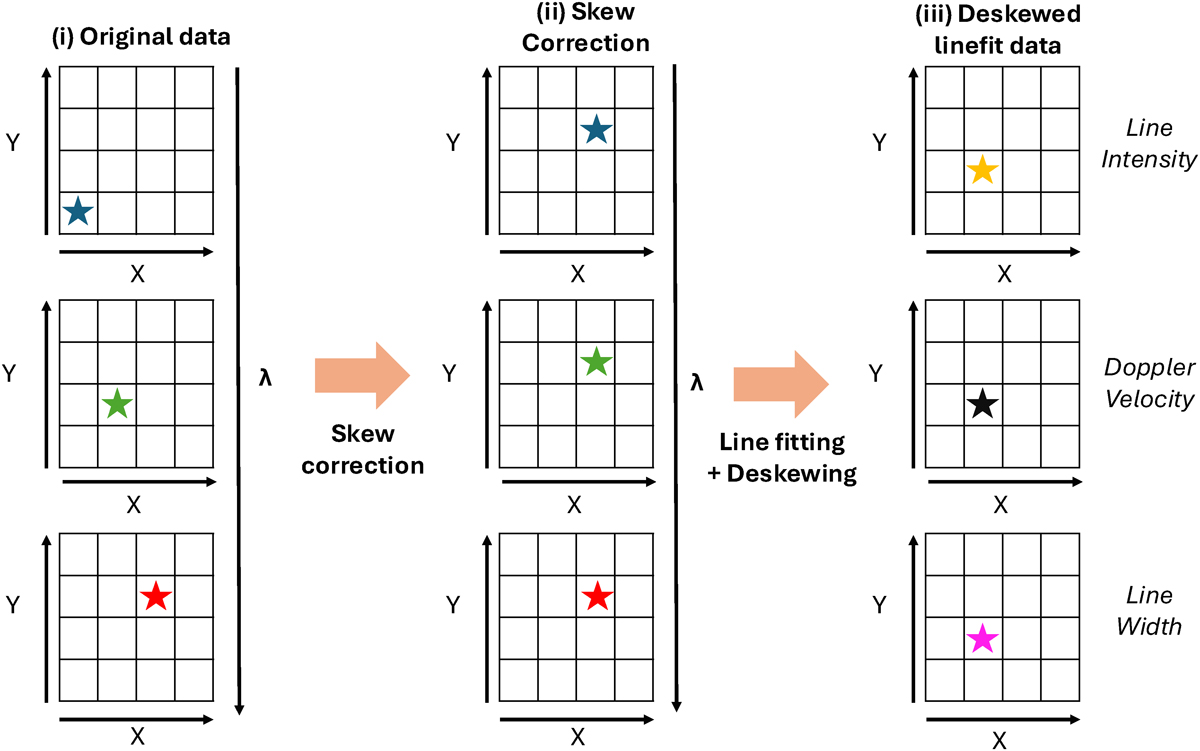
Fig. 4.
Download original image
Schematic of the algorithm. Left panels: Representation of the original data showing the wavelength-dependent spatial shift. The line center location is shown by the green star in the middle row. Middle panels: Representation of the data after the shift (or skew) is removed, showing that a leftover spatial shift is present – the line center position has moved compared to the input. Right panels: After line fitting, the deskewing moves the position of the fit parameter images back to the original line center position.
Current usage metrics show cumulative count of Article Views (full-text article views including HTML views, PDF and ePub downloads, according to the available data) and Abstracts Views on Vision4Press platform.
Data correspond to usage on the plateform after 2015. The current usage metrics is available 48-96 hours after online publication and is updated daily on week days.
Initial download of the metrics may take a while.