Fig. 5.
Download original image
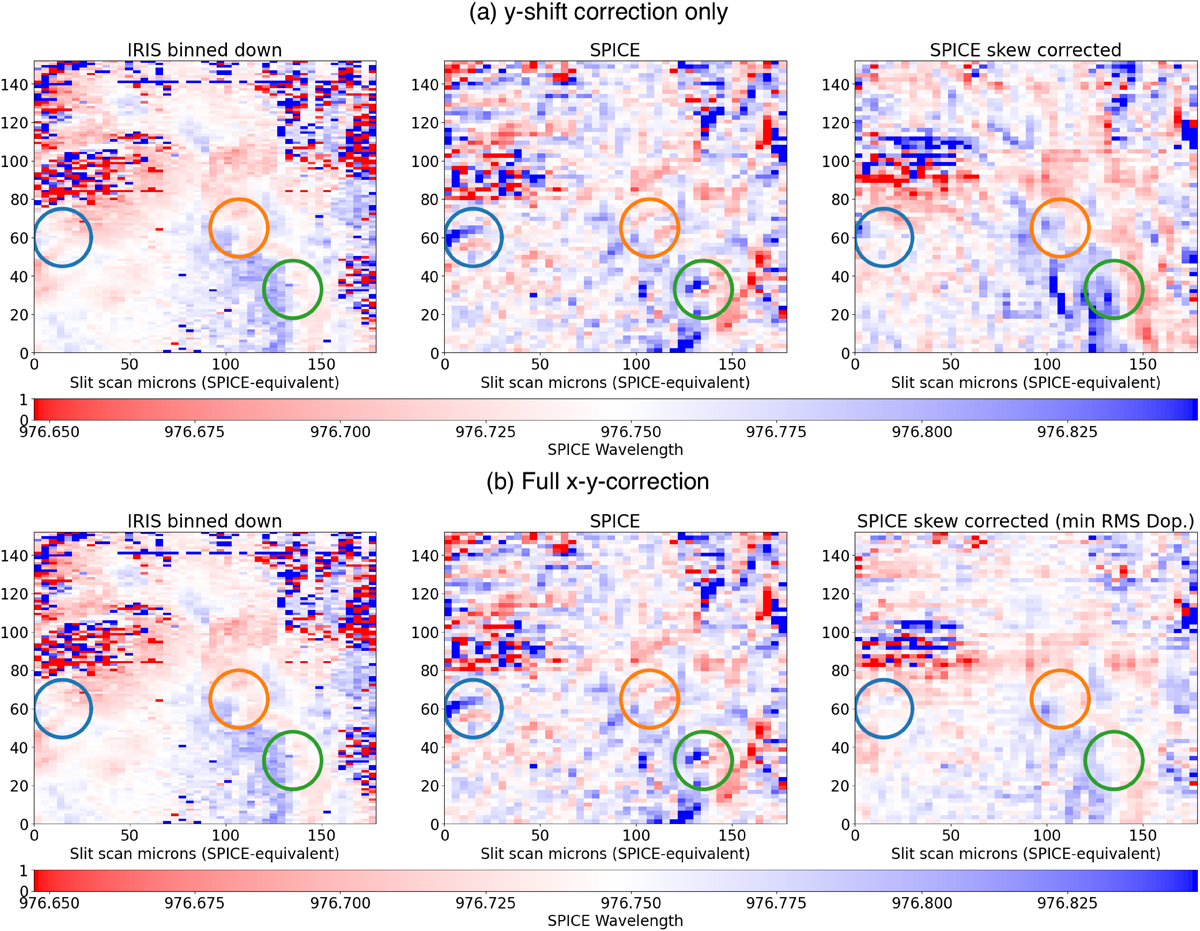
New correction method applied to the same dataset as in Figure 2. Top row (panels (a)): Result from a y-only wavelength shift applied with the same parameters used in the aforementioned figure. Second row (panels (b)): Results with both x and y wavelength-dependent shifts. Notably, including only the y-shift shown in panels (a) does not fully remove the Doppler velocity artifacts. In contrast, including the full x − y shift results in very good agreement between the IRIS and SPICE observations.
Current usage metrics show cumulative count of Article Views (full-text article views including HTML views, PDF and ePub downloads, according to the available data) and Abstracts Views on Vision4Press platform.
Data correspond to usage on the plateform after 2015. The current usage metrics is available 48-96 hours after online publication and is updated daily on week days.
Initial download of the metrics may take a while.