Fig. 6.
Download original image
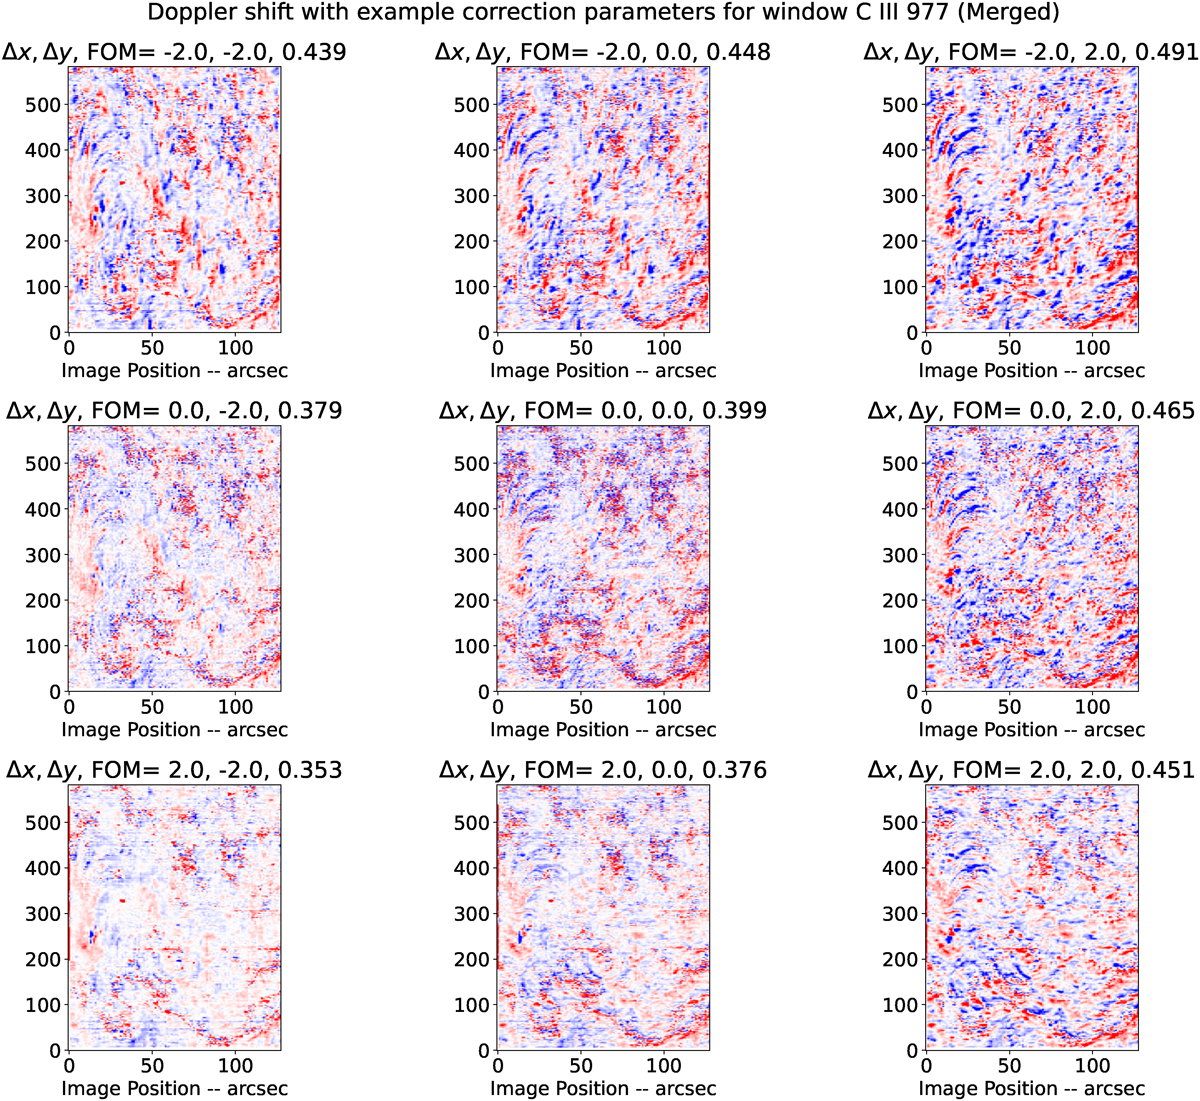
De-trended Doppler shift signals, on which the figure of merit is based, for the SPICE observations used in the previous PSF work in Paper I and Figure 5. The subpanels show the resulting Doppler shifts from different shift parameters, noted above each subplot. With the highest quality Doppler shift correction around Δx = 2 arc second/Å and Δy = −2 arc second/Å this figure is consistent with the automated search determination of [2, −1.667], as shown in Figure 7.
Current usage metrics show cumulative count of Article Views (full-text article views including HTML views, PDF and ePub downloads, according to the available data) and Abstracts Views on Vision4Press platform.
Data correspond to usage on the plateform after 2015. The current usage metrics is available 48-96 hours after online publication and is updated daily on week days.
Initial download of the metrics may take a while.