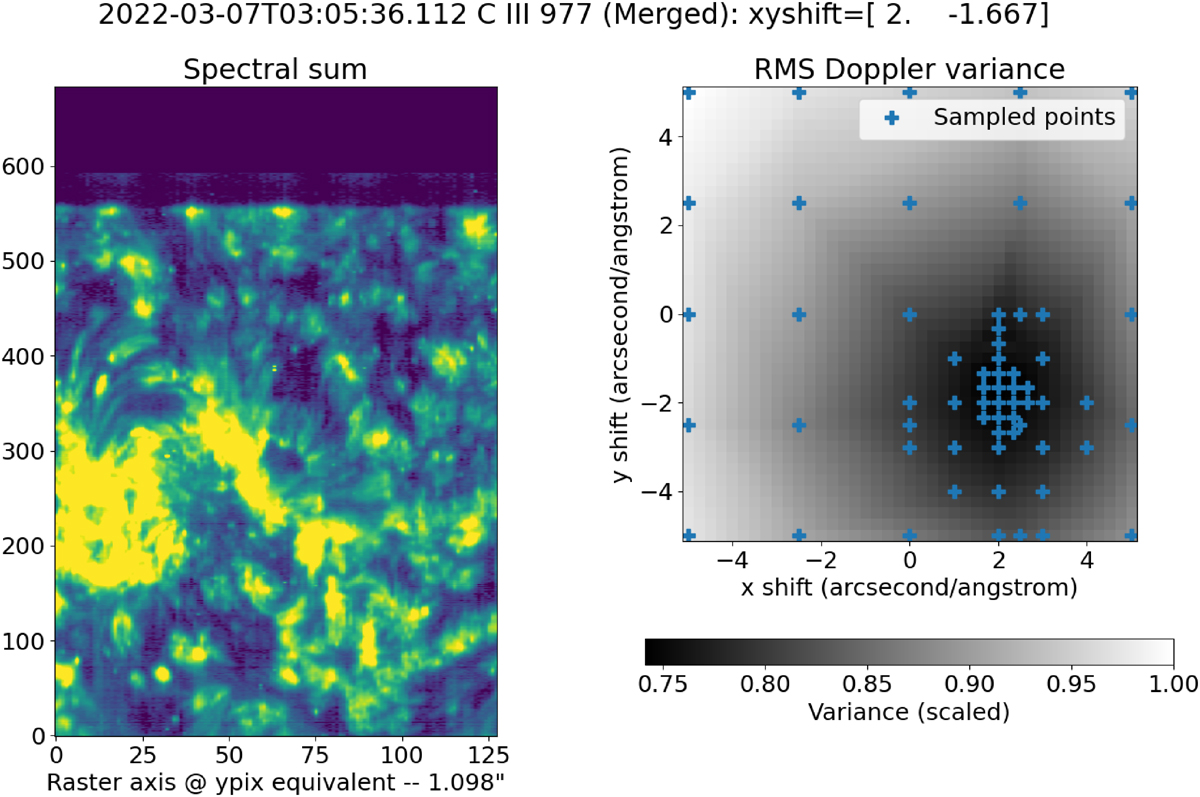
Fig. 7.
Download original image
Figure of merit surface in the x − λ and y − λ shift parameter for the SPICE observations obtained during the IRIS coordinated observing campaign used for the previous PSF estimation efforts. Right panel: Figure of merit surface. Left panel: Spectral sum of the window for comparison in the C III 977 Å line. The spectral sum is calculated at each pixel by summing the intensity across all wavelengths in the spectrum. The blue points in the right panel denote where the search procedure checked the figure of merit. The figure of merit shows a clear preference for both x − λ and y − λ shifts, as confirmed by the better match to IRIS observations.
Current usage metrics show cumulative count of Article Views (full-text article views including HTML views, PDF and ePub downloads, according to the available data) and Abstracts Views on Vision4Press platform.
Data correspond to usage on the plateform after 2015. The current usage metrics is available 48-96 hours after online publication and is updated daily on week days.
Initial download of the metrics may take a while.