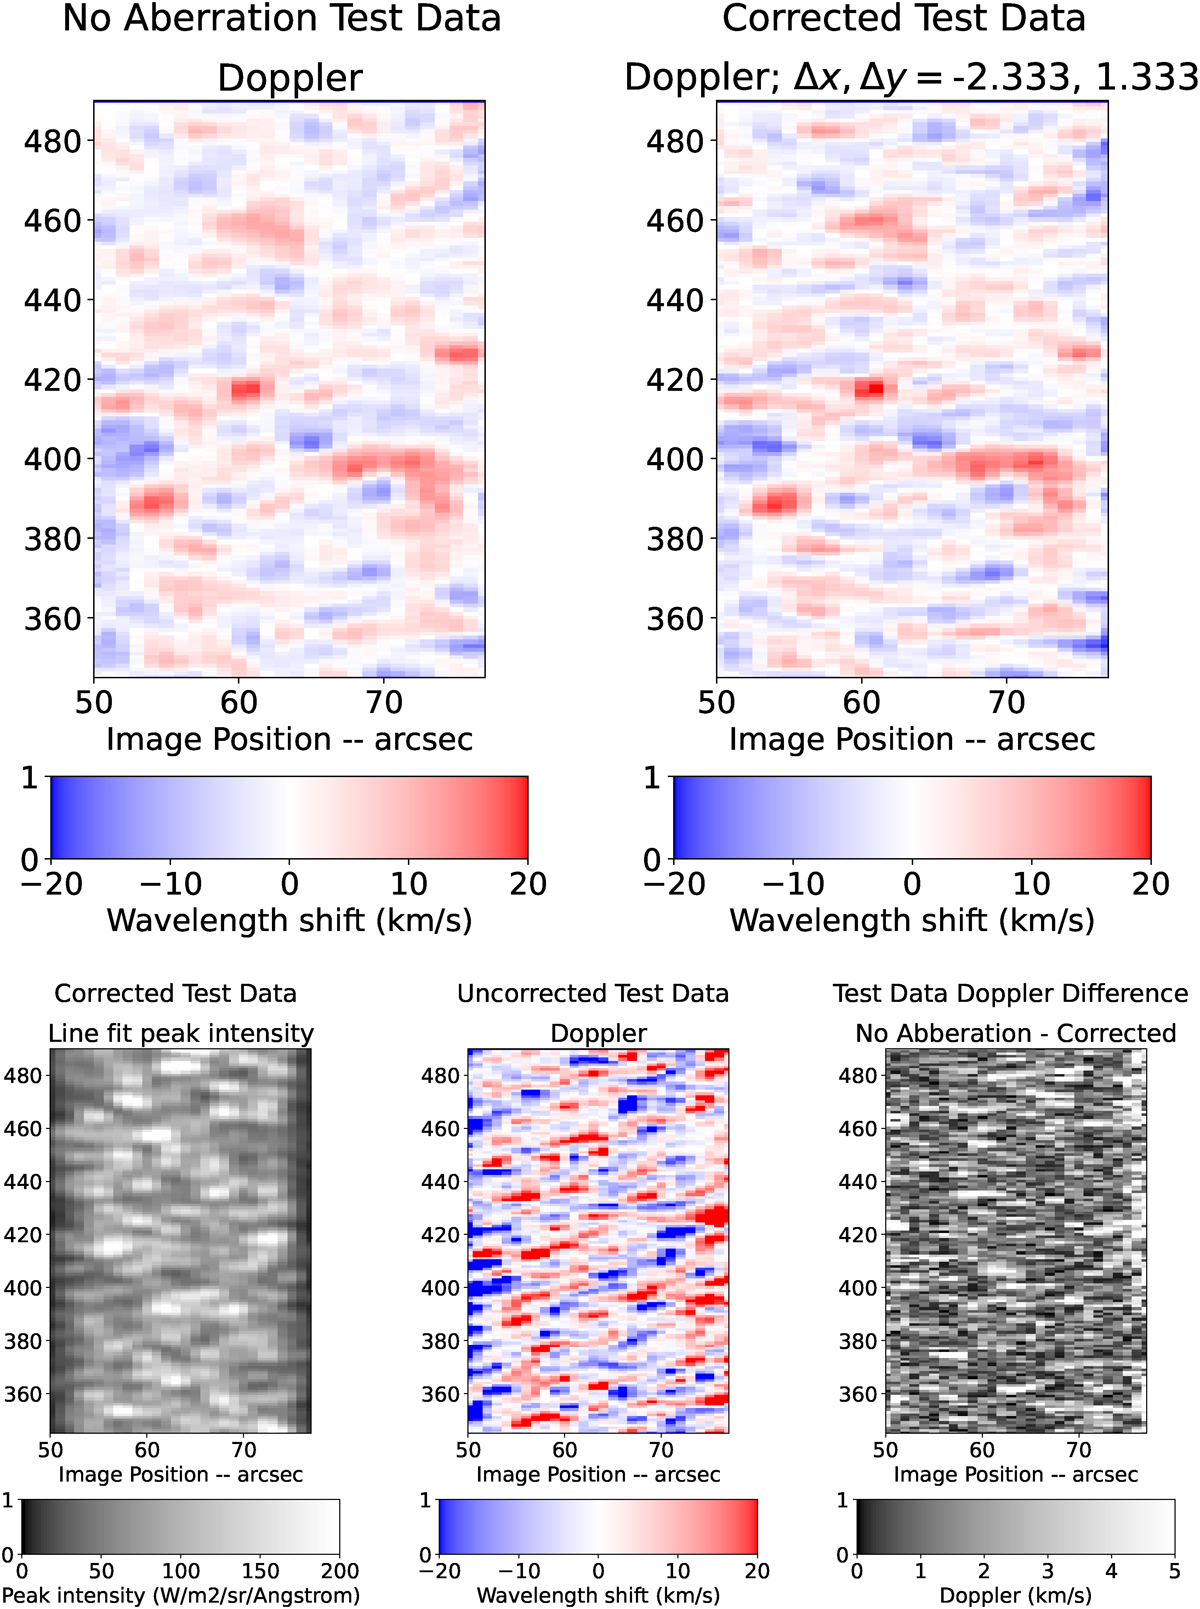
Fig. 8.
Download original image
Results of an “end-to-end” test of the new method using random test data. Top left: Doppler shifts with a nominal (no aberration) PSF. Top right: Doppler shifts with an aberrant PSF and correction, produced from the same underlying data. The correction recovers the test results well – at lower right the magnitude of the difference between the two is shown to be under 5 km/s except for very low signal regions adjacent to high signal ones. The uncorrected Doppler shifts (lower center) show far larger differences, overwhelming the actual signal in this test dataset. The line fit intensity is shown at the lower left for reference.
Current usage metrics show cumulative count of Article Views (full-text article views including HTML views, PDF and ePub downloads, according to the available data) and Abstracts Views on Vision4Press platform.
Data correspond to usage on the plateform after 2015. The current usage metrics is available 48-96 hours after online publication and is updated daily on week days.
Initial download of the metrics may take a while.