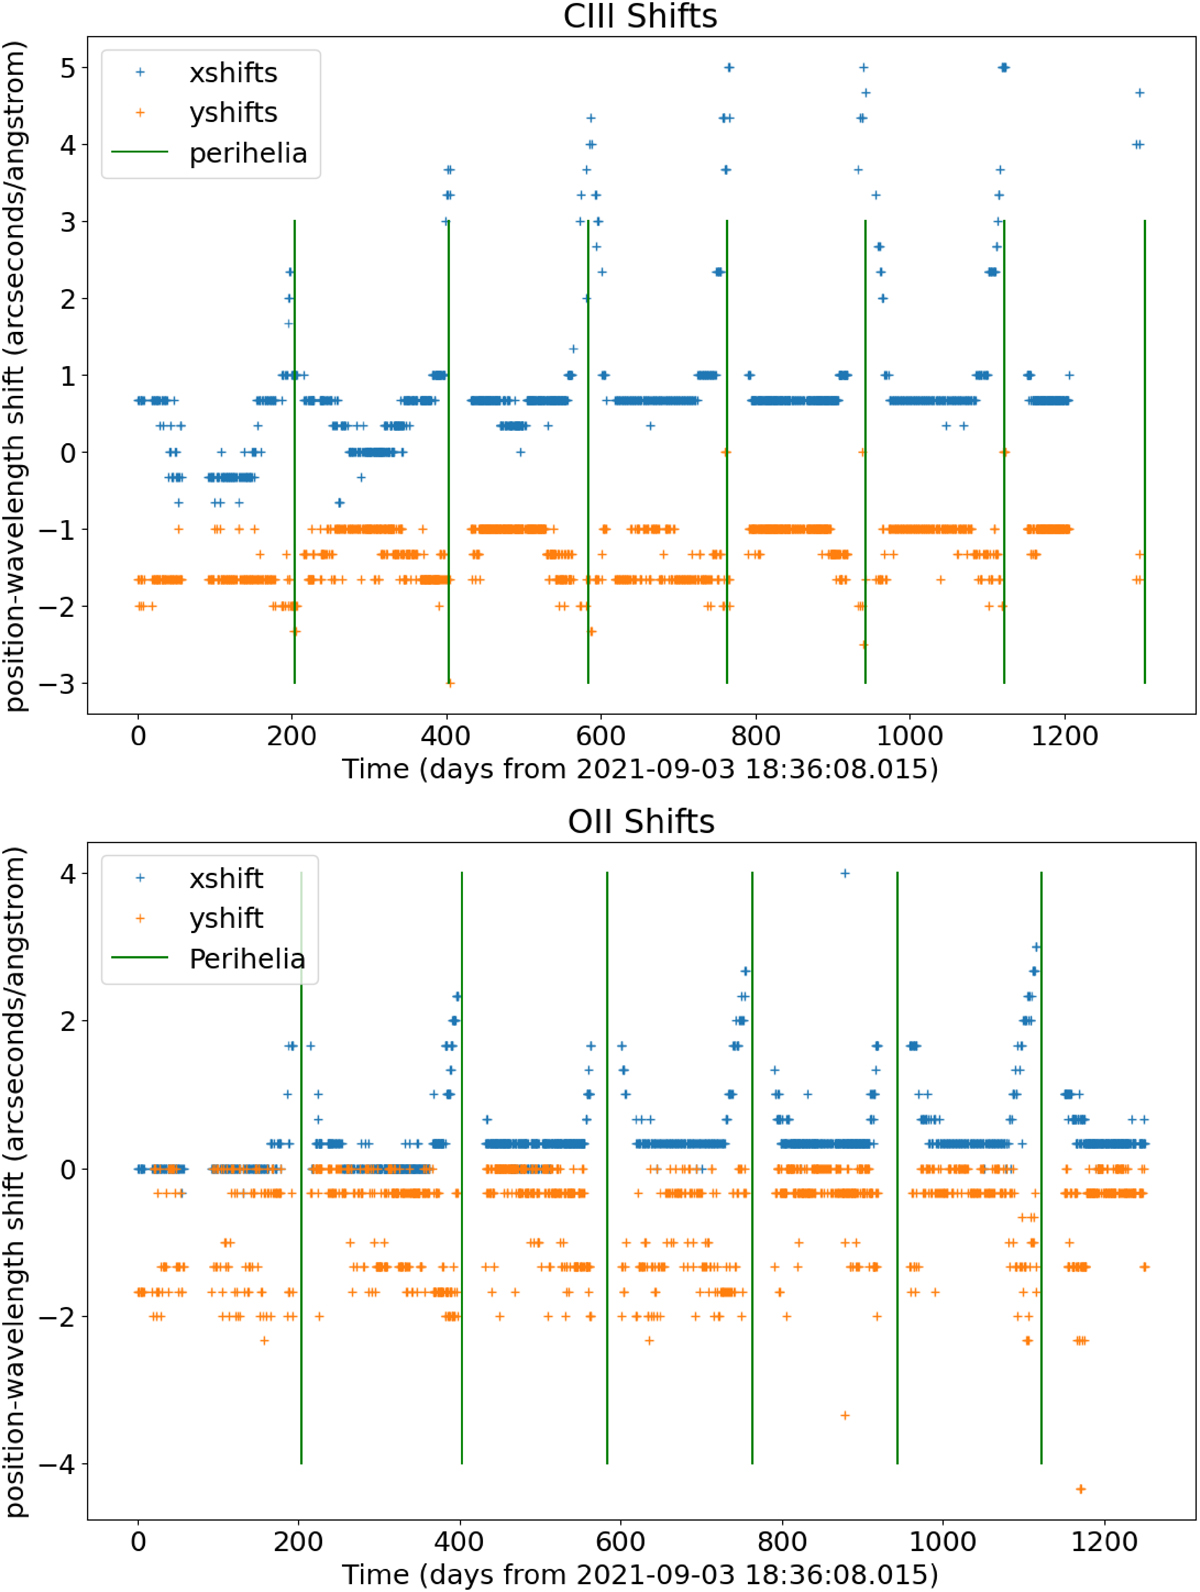
Fig. 9.
Download original image
Time variation of the x and y shift parameters computed in the SPICE SPROUTs observations. Upper panel: Shifts for the C III 977 Å line. Lower panel: Same, but for the relatively dim O II 718 Å line in the shortwave detector. The shifts show large changes near perihelia passages and return to a consistent background level (outside of the first ∼2 years) when the spacecraft is more distant from the Sun. The scatter in the shifts is a rough indicator of the level of uncertainty in the observations. The shifts differ between the spectral lines, indicating a wavelength or detector-position dependence in the amount of shift, although some of the difference could be due to lower S/N in the O II line. The vertical green lines show the SolO perihelia times.
Current usage metrics show cumulative count of Article Views (full-text article views including HTML views, PDF and ePub downloads, according to the available data) and Abstracts Views on Vision4Press platform.
Data correspond to usage on the plateform after 2015. The current usage metrics is available 48-96 hours after online publication and is updated daily on week days.
Initial download of the metrics may take a while.