Fig. 1.
Download original image
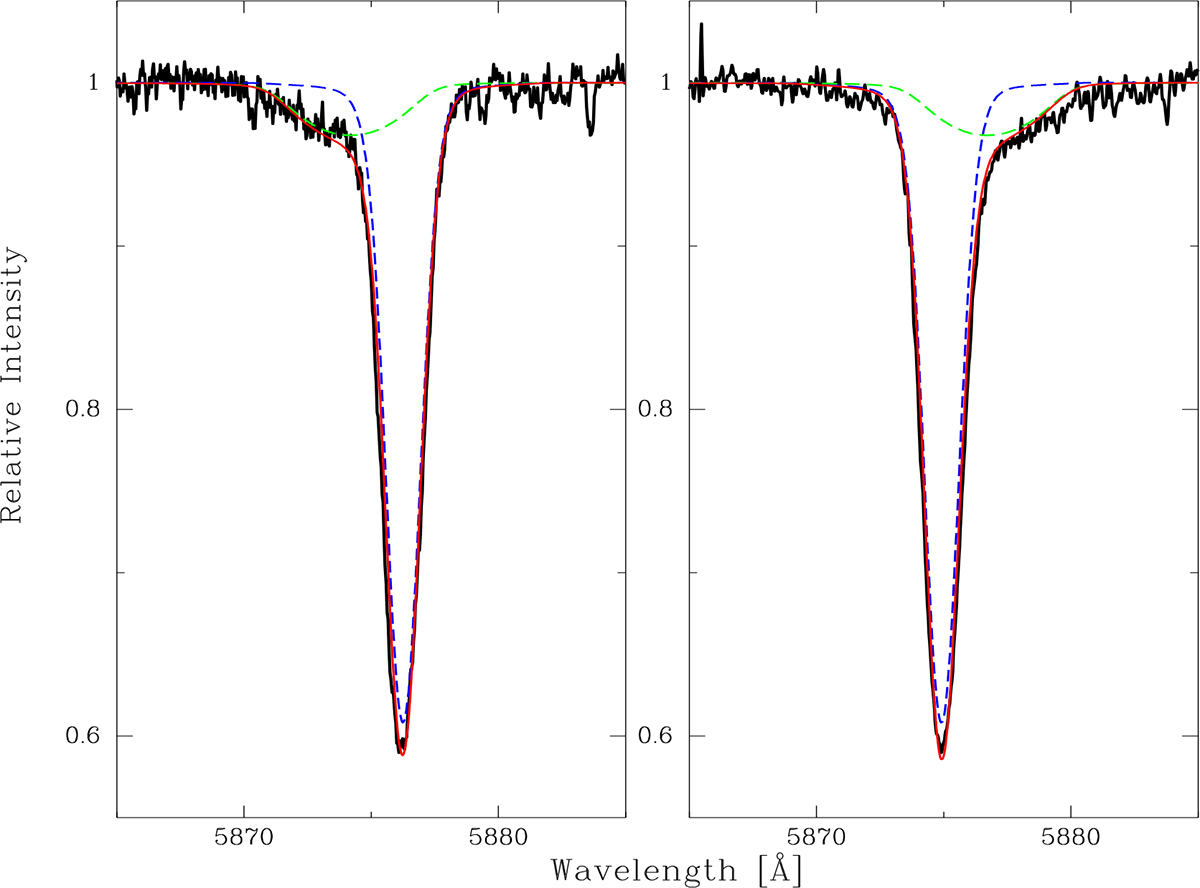
Comparison of observed composite spectra of HD 93028 at opposite phases of maximum separation (in black) with synthetic templates shifted in RVs around the He Iλ5876 spectral line. The individual synthetic spectra for each component are overplotted with dashed blue and green lines, representing the primary and the secondary, respectively. The solid red line corresponds to the combined synthetic spectrum (see Sect. 3.3 for information on the generation of synthetic spectra).
Current usage metrics show cumulative count of Article Views (full-text article views including HTML views, PDF and ePub downloads, according to the available data) and Abstracts Views on Vision4Press platform.
Data correspond to usage on the plateform after 2015. The current usage metrics is available 48-96 hours after online publication and is updated daily on week days.
Initial download of the metrics may take a while.