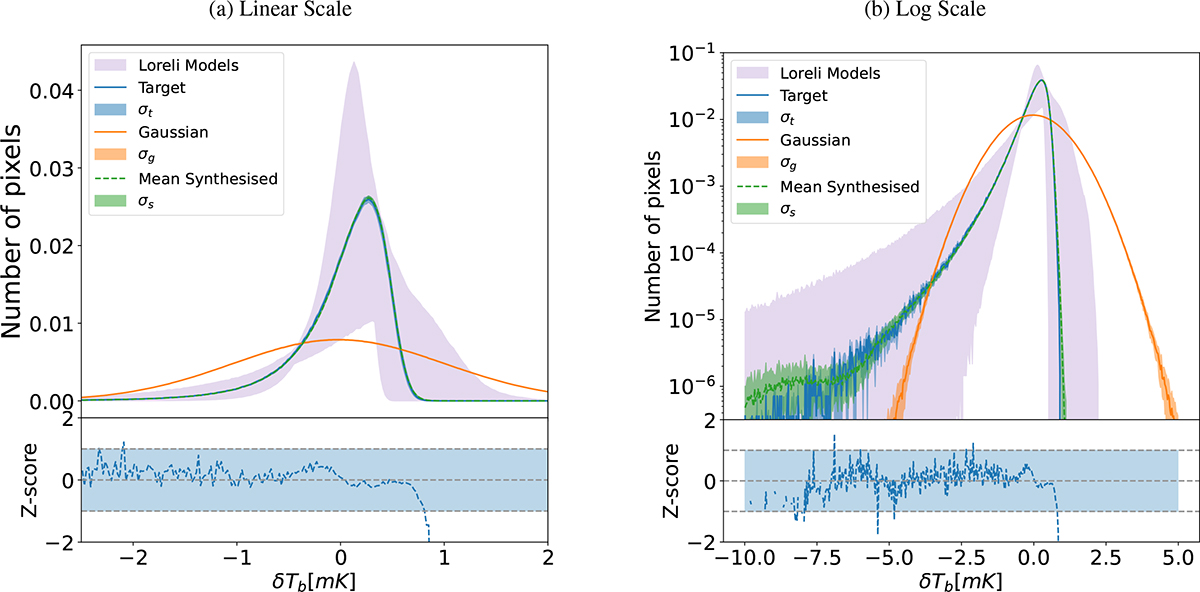
Fig. 6.
Download original image
Linear- and log-scale histograms of the target EoR lightcone and a synthesised lightcone after the inverse quantile transform. The histogram of the synthesised lightcone, showing the mean of 30 realisations and their standard deviation (shaded region), recovers the histogram of the target lightcone well, including its skewness.
Current usage metrics show cumulative count of Article Views (full-text article views including HTML views, PDF and ePub downloads, according to the available data) and Abstracts Views on Vision4Press platform.
Data correspond to usage on the plateform after 2015. The current usage metrics is available 48-96 hours after online publication and is updated daily on week days.
Initial download of the metrics may take a while.