Fig. 7.
Download original image
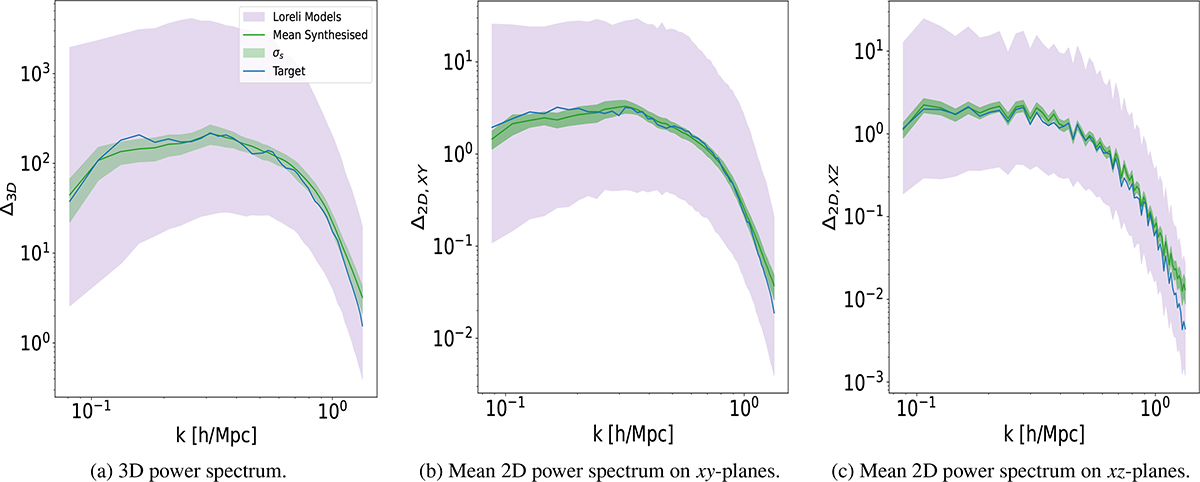
Comparison between the target and synthesised lightcones after the inverse quantile transform, showing power spectra across different dimensions. (a) Spherically-averaged 3D power spectrum. (b) 2D power spectrum estimated on xy-planes. (c) 2D power spectrum estimated on xz-planes. In all cases the power spectra of the synthesised lightcones reproduce the largest scales well, with increasing deviations at smaller scales.
Current usage metrics show cumulative count of Article Views (full-text article views including HTML views, PDF and ePub downloads, according to the available data) and Abstracts Views on Vision4Press platform.
Data correspond to usage on the plateform after 2015. The current usage metrics is available 48-96 hours after online publication and is updated daily on week days.
Initial download of the metrics may take a while.