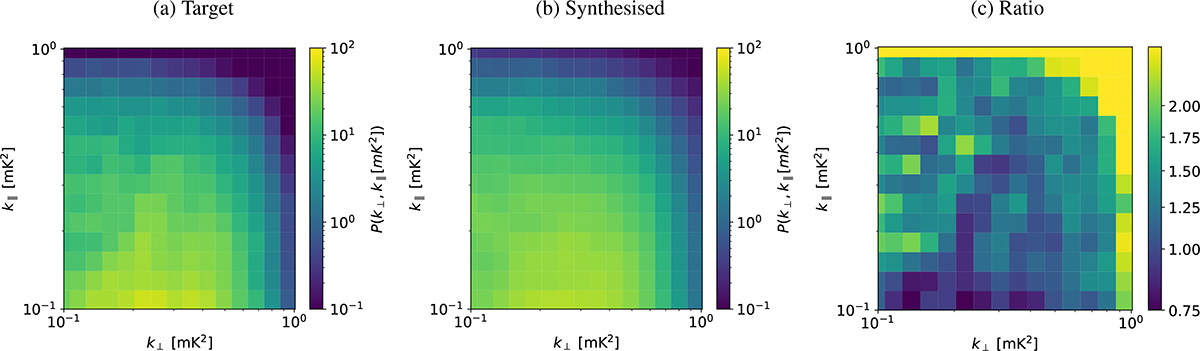
Fig. 8.
Download original image
Comparisons of the cylindrically averaged power spectrum of the target lightcone (left) and synthesised lightcones (middle) after the inverse quantile transform. The ratio between the two cylindrically averaged power spectra is also shown (right), with the power spectra of the synthesised lightcones reproducing that of the target lightcone within 25%, on most scales below k∥ = 0.3 h Mpc−1.
Current usage metrics show cumulative count of Article Views (full-text article views including HTML views, PDF and ePub downloads, according to the available data) and Abstracts Views on Vision4Press platform.
Data correspond to usage on the plateform after 2015. The current usage metrics is available 48-96 hours after online publication and is updated daily on week days.
Initial download of the metrics may take a while.