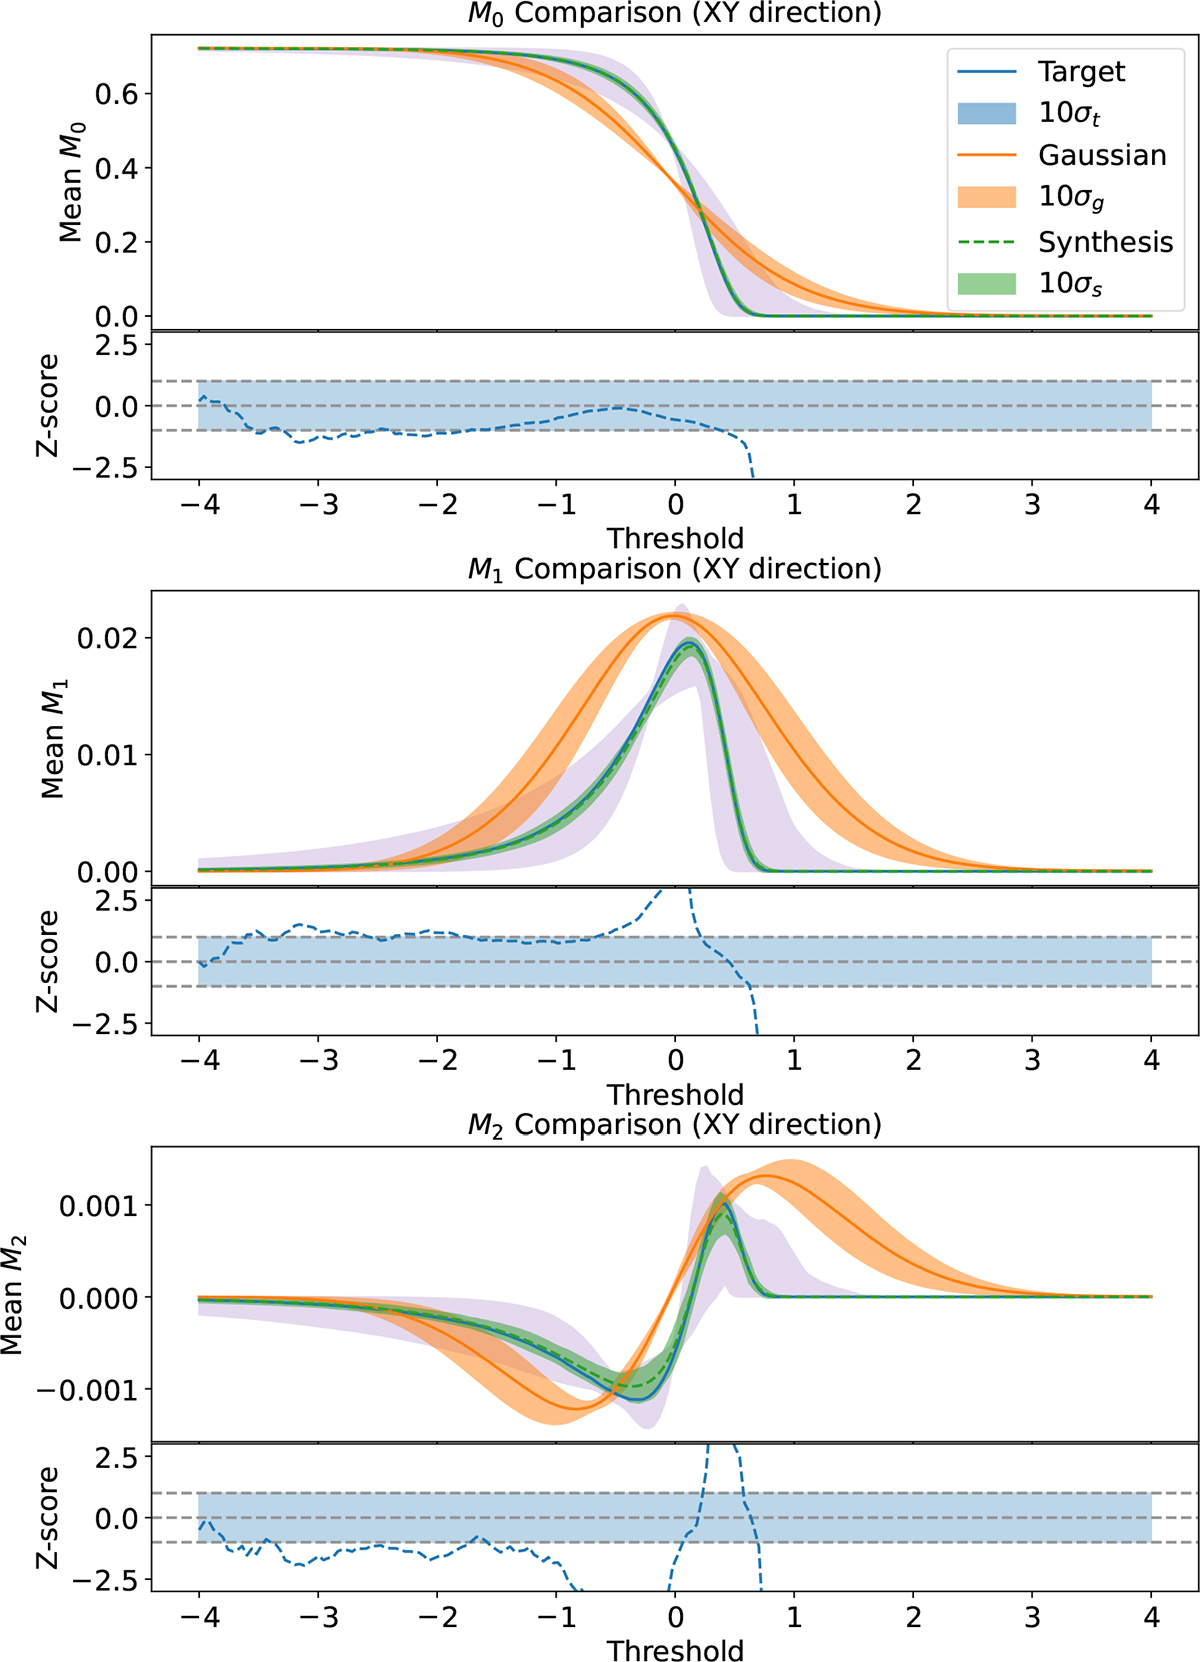
Fig. 9.
Download original image
Comparison of the Minkowski functionals applied to each frequency channel of the lightcone between the synthesised lightcones (after the inverse quantile transform) and the target lightcone. The mean Minkowski functionals across the lightcone are shown, with shaded regions indicating their standard deviation. From the bottom panel, M0 and M1 of the synthesised lightcones recover the target lightcone’s Minkowski functionals well, lying within the octant variance, σtoct, and reproducing its morphology. The M2 of the synthesised lightcone follows that of the target lightcone and lies within ±2.5σtoct.
Current usage metrics show cumulative count of Article Views (full-text article views including HTML views, PDF and ePub downloads, according to the available data) and Abstracts Views on Vision4Press platform.
Data correspond to usage on the plateform after 2015. The current usage metrics is available 48-96 hours after online publication and is updated daily on week days.
Initial download of the metrics may take a while.