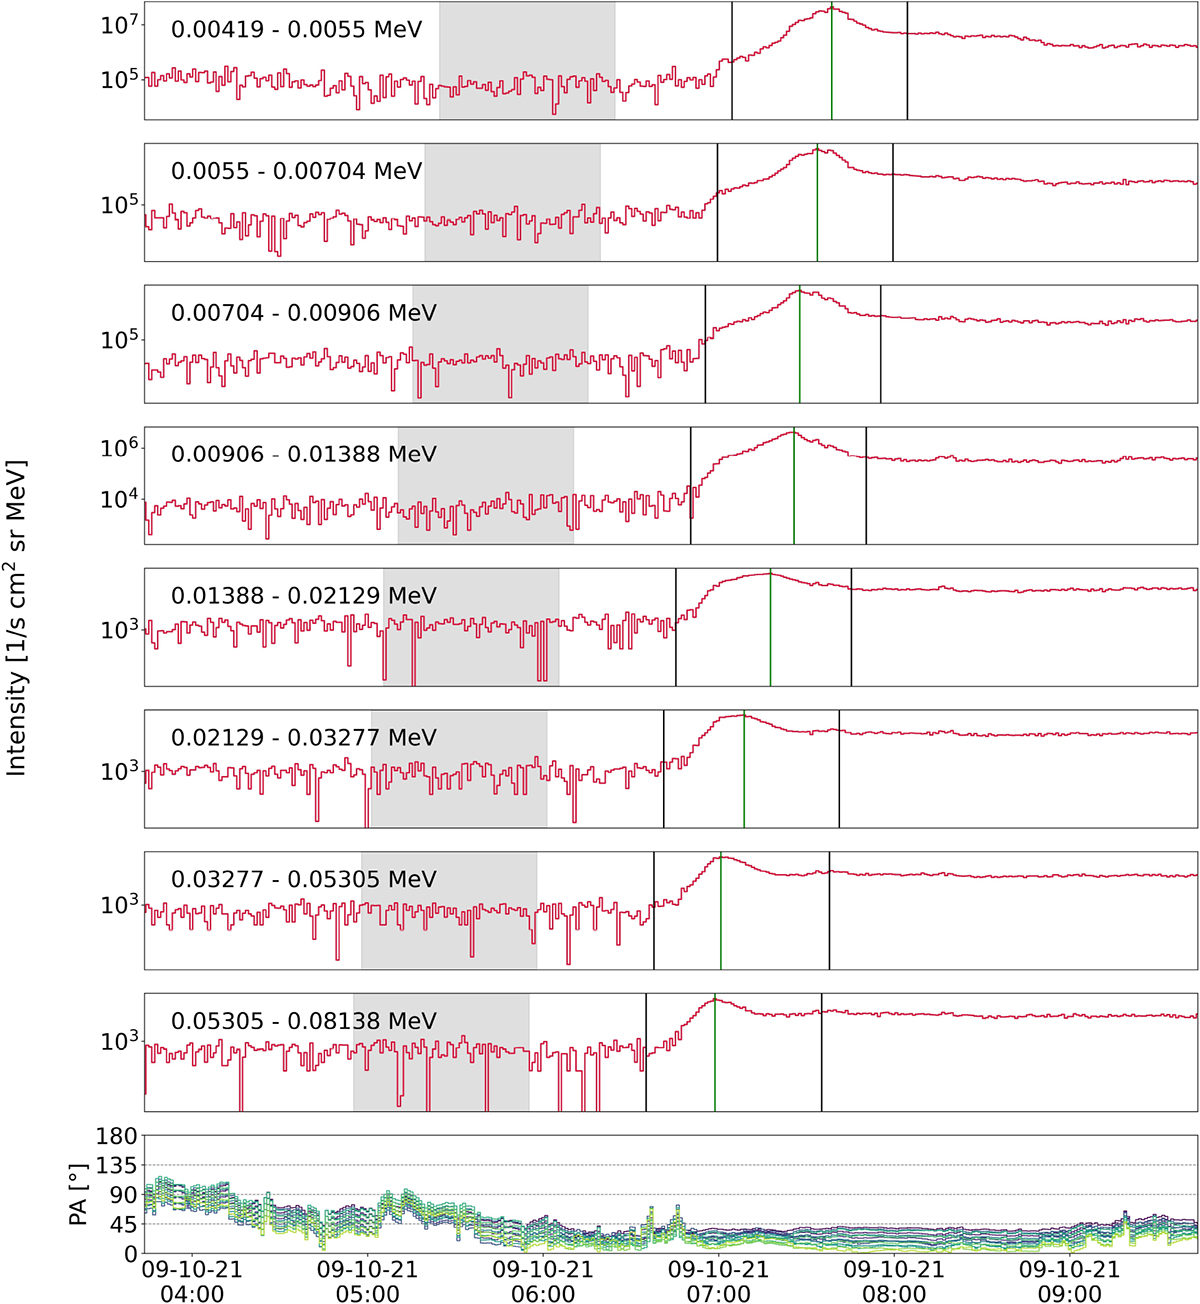
Fig. A.1.
Download original image
Example of intensity-time series showcasing the determination of the peak intensities. The top eight panels show the intensity measured at eight selected energy channels of STEP (energy ranges are provided in the legends). The vertical black lines in each of these panels represent the time window within which we look for the peak intensity. The time windows follow the trend of velocity dispersion. The vertical green lines denote the peak intensity found for each channel, and the grey area is the pre-event background that we subtract from the peak intensity. The bottom panel represents the pitch-angle coverage of STEP. We show only the centre pitch-angles of each of the 15 pixels of STEP without the pixel opening angles.
Current usage metrics show cumulative count of Article Views (full-text article views including HTML views, PDF and ePub downloads, according to the available data) and Abstracts Views on Vision4Press platform.
Data correspond to usage on the plateform after 2015. The current usage metrics is available 48-96 hours after online publication and is updated daily on week days.
Initial download of the metrics may take a while.