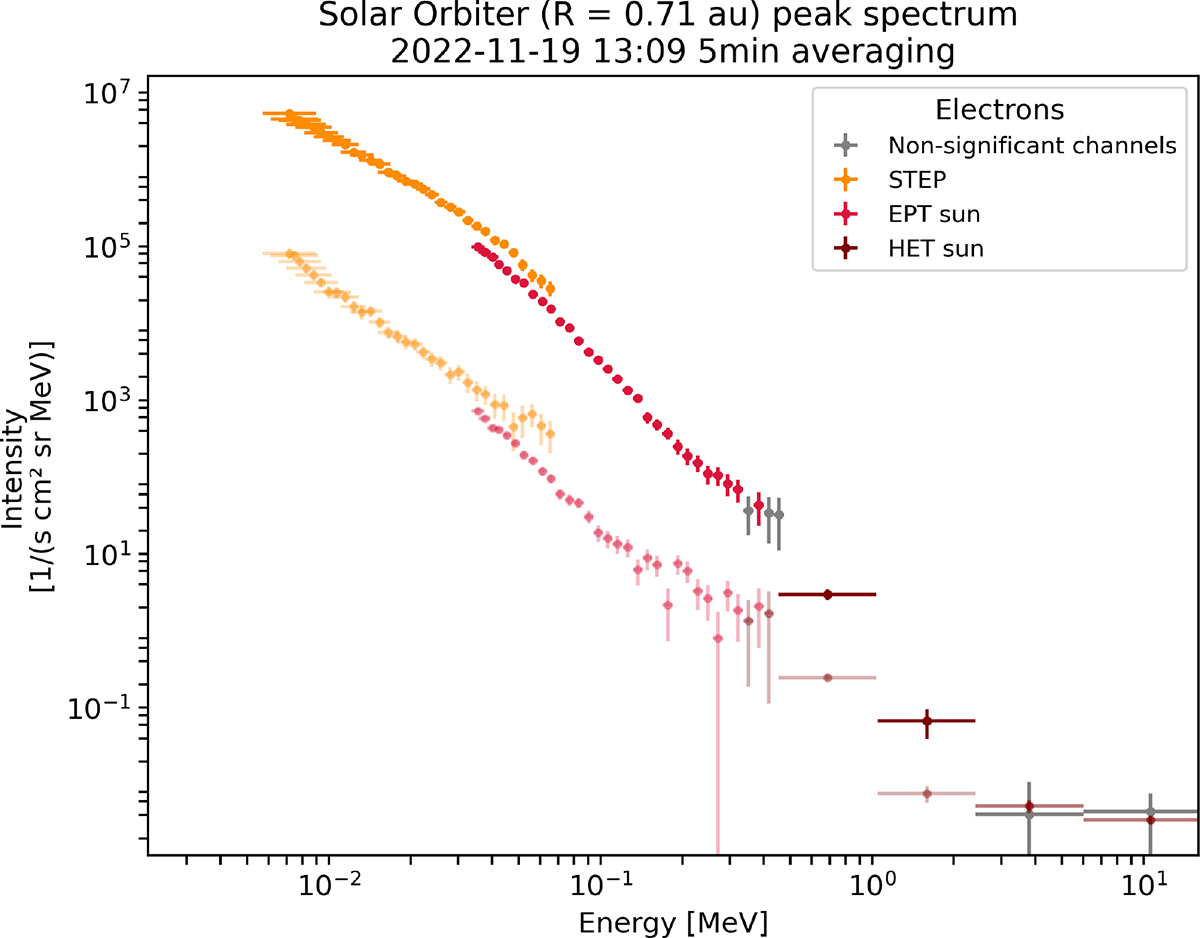
Fig. B.2.
Download original image
Example of a peak-intensity spectrum without shifting STEP data. The orange points correspond to STEP measurements, the red ones to EPT data and maroon to HET data. The grey points correspond to energy channels that do not meet our significance threshold. The light and fainter points mark the pre-event background that is also subtracted from the peak-intensity measurements.
Current usage metrics show cumulative count of Article Views (full-text article views including HTML views, PDF and ePub downloads, according to the available data) and Abstracts Views on Vision4Press platform.
Data correspond to usage on the plateform after 2015. The current usage metrics is available 48-96 hours after online publication and is updated daily on week days.
Initial download of the metrics may take a while.