Fig. 3.
Download original image
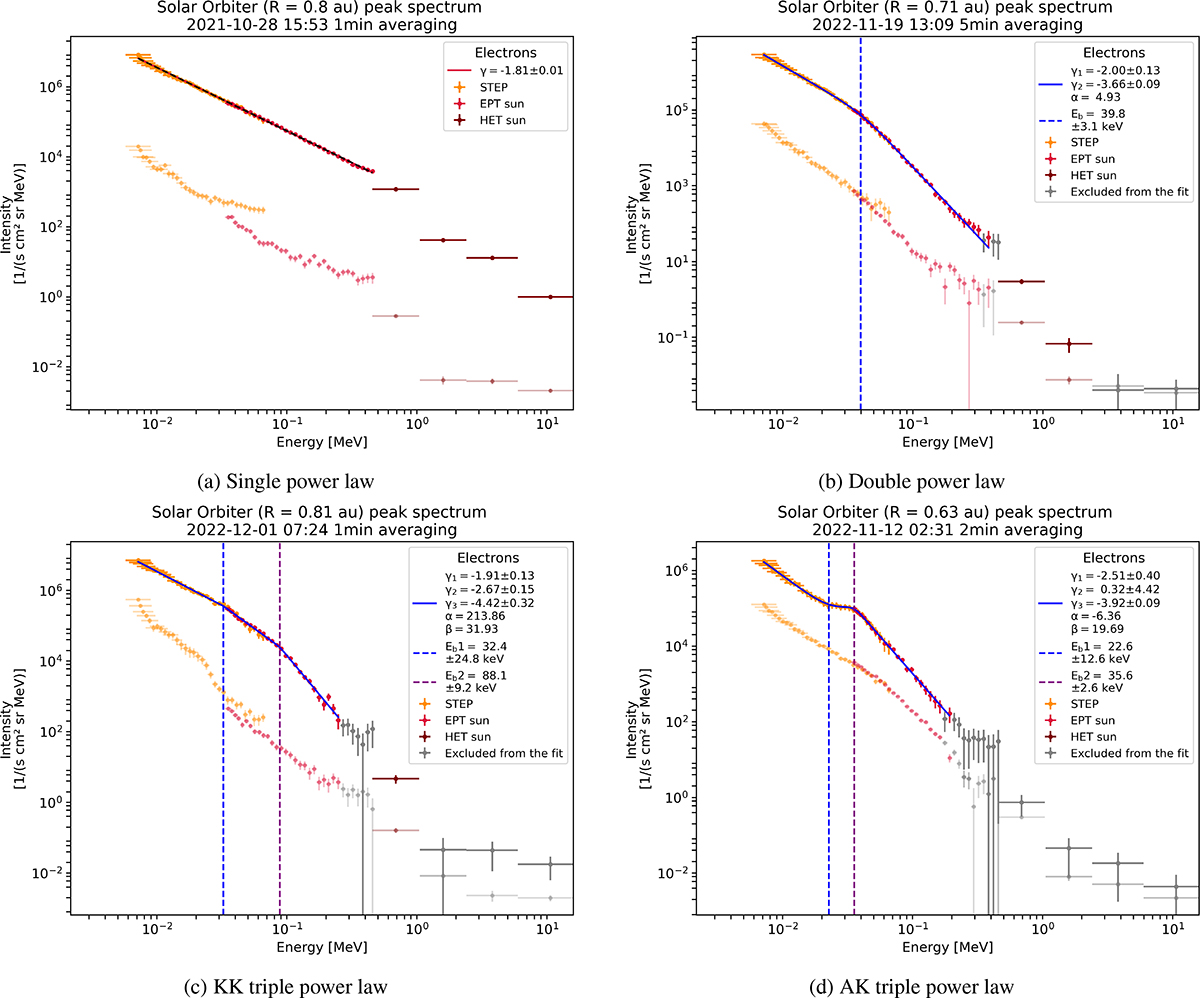
Example spectra showcasing the four most common spectral shapes we find when fitting the peak-intensity spectra of the events in our list. (a) Single power law. (b) Double power law. (c) Triple power law (with consecutive spectral softening). (d) Triple power law with a plateau after first break. The orange, red, and maroon points represent STEP, EPT, and HET data, respectively. The fainter and lower intensity points show the pre-event background that is subtracted from the peak intensities. The grey points denote energy channels that were excluded from the fits (see Appendix A). Note: we applied the fits only in the energy range covered by STEP and EPT. The dashed vertical blue and purple lines represent the spectral breaks, and the legends provide the fit parameters.
Current usage metrics show cumulative count of Article Views (full-text article views including HTML views, PDF and ePub downloads, according to the available data) and Abstracts Views on Vision4Press platform.
Data correspond to usage on the plateform after 2015. The current usage metrics is available 48-96 hours after online publication and is updated daily on week days.
Initial download of the metrics may take a while.