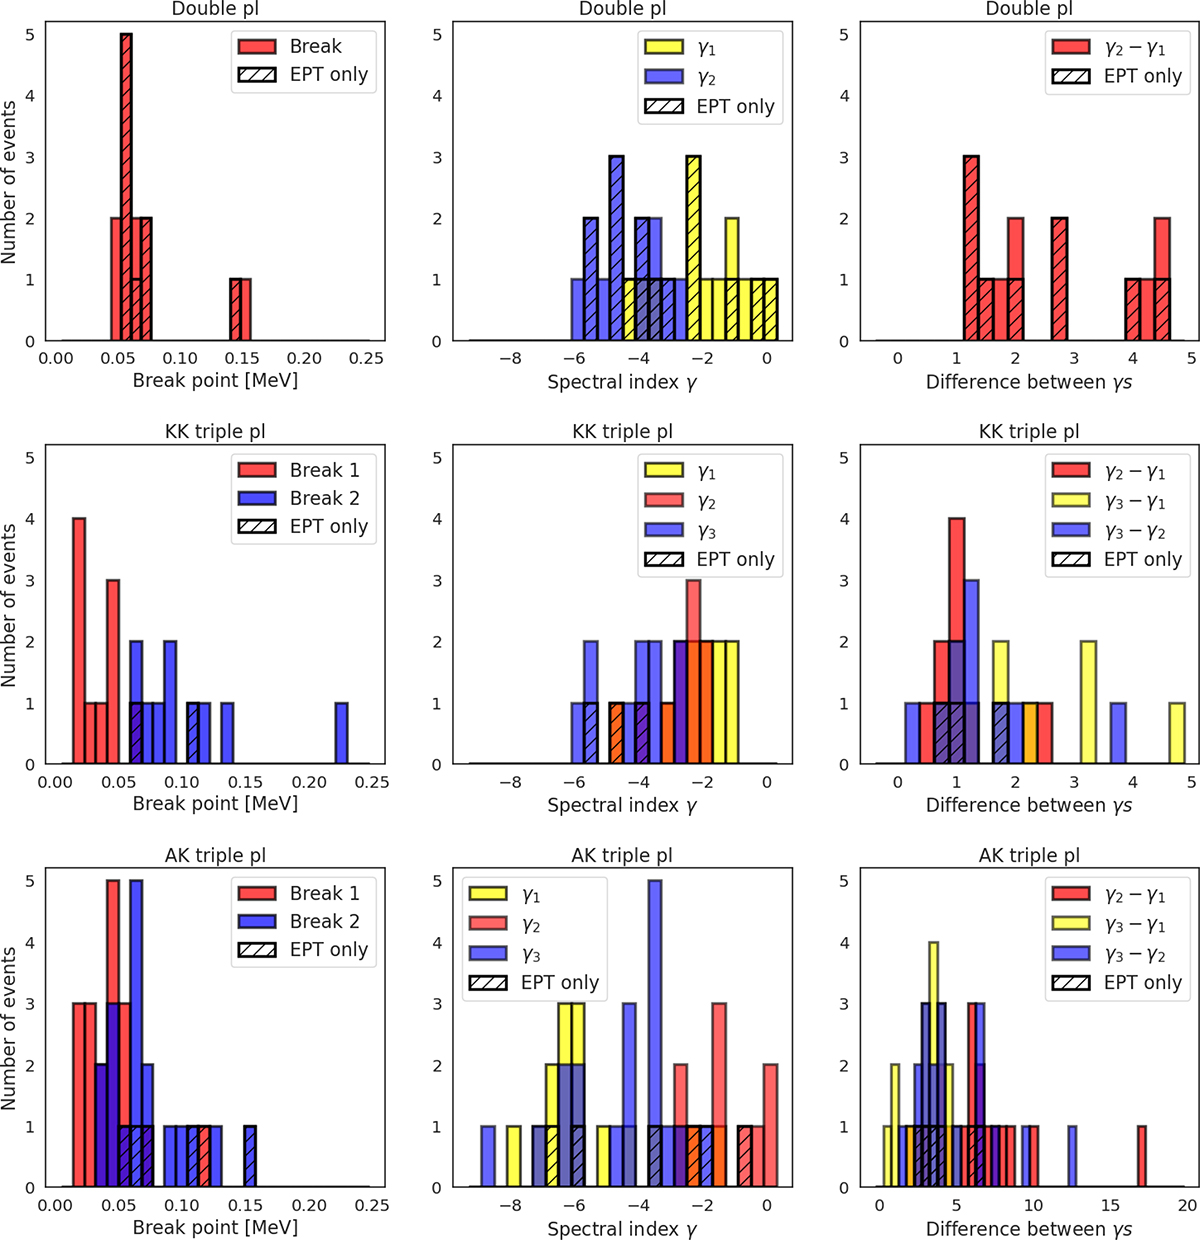
Fig. 4.
Download original image
Distributions of (Column 1) break energies, (Column 2) spectral indices (γ1, γ2, and γ3), and (Column 3) the absolute value of the difference between the spectral indices, which represents the magnitude of the spectral change between spectral indices, of the double power law fits (row 1), of the triple power law fits that become progressively softer (row 2), and the triple power law fits that have a plateau or spectral hardening after the first break (row 3). The events measured only by EPT are marked by black hatching.
Current usage metrics show cumulative count of Article Views (full-text article views including HTML views, PDF and ePub downloads, according to the available data) and Abstracts Views on Vision4Press platform.
Data correspond to usage on the plateform after 2015. The current usage metrics is available 48-96 hours after online publication and is updated daily on week days.
Initial download of the metrics may take a while.