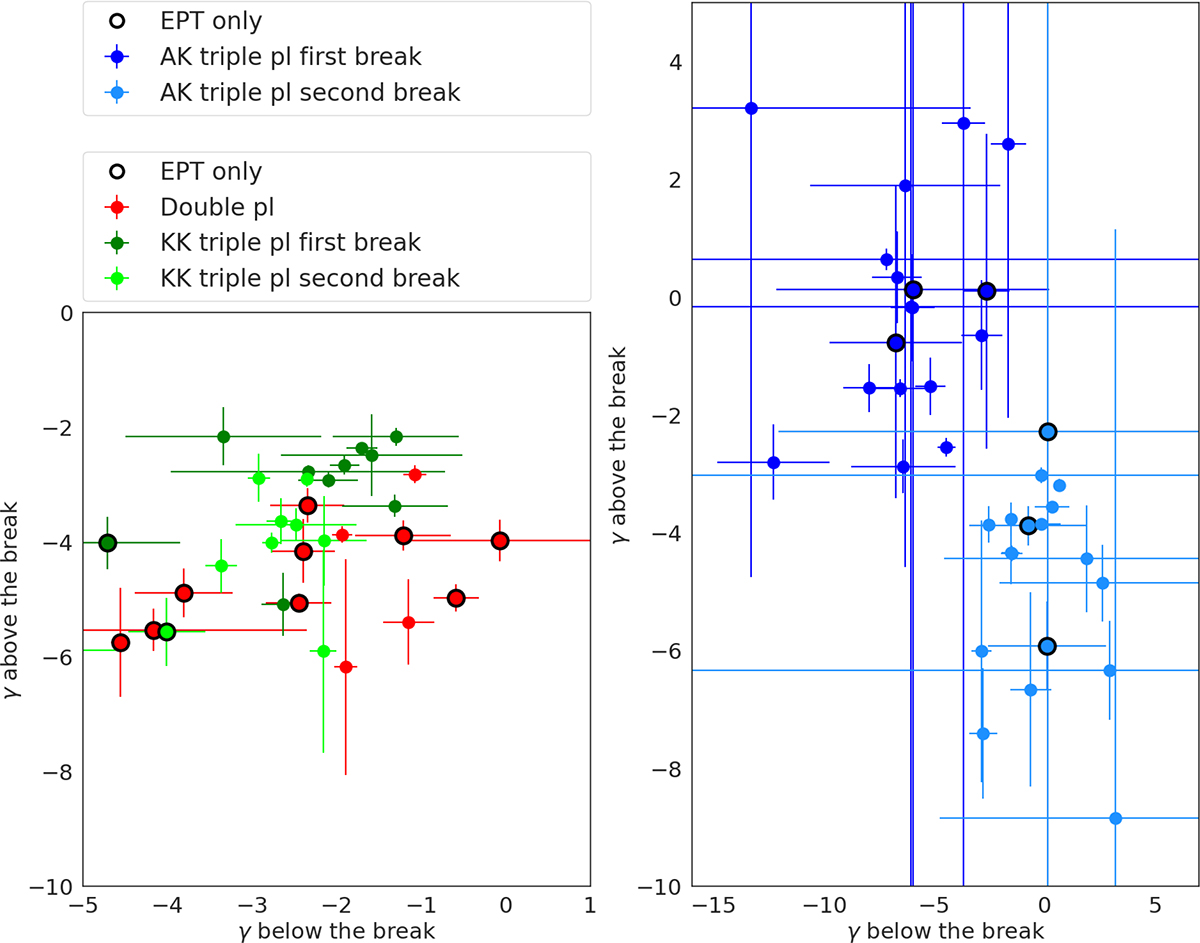
Fig. 5.
Download original image
Dependence between the spectral indices before and after the spectral breaks. Left: Double power law fits (red). KK triple power law fits (green, with the first and second break in different shades). Right: Spectral index values for triple power laws with a plateau-like structure. The different shades represent the spectral indices on both sides of the first and second break. Spectra that were determined with EPT only are marked with black circles.
Current usage metrics show cumulative count of Article Views (full-text article views including HTML views, PDF and ePub downloads, according to the available data) and Abstracts Views on Vision4Press platform.
Data correspond to usage on the plateform after 2015. The current usage metrics is available 48-96 hours after online publication and is updated daily on week days.
Initial download of the metrics may take a while.