Fig. 8.
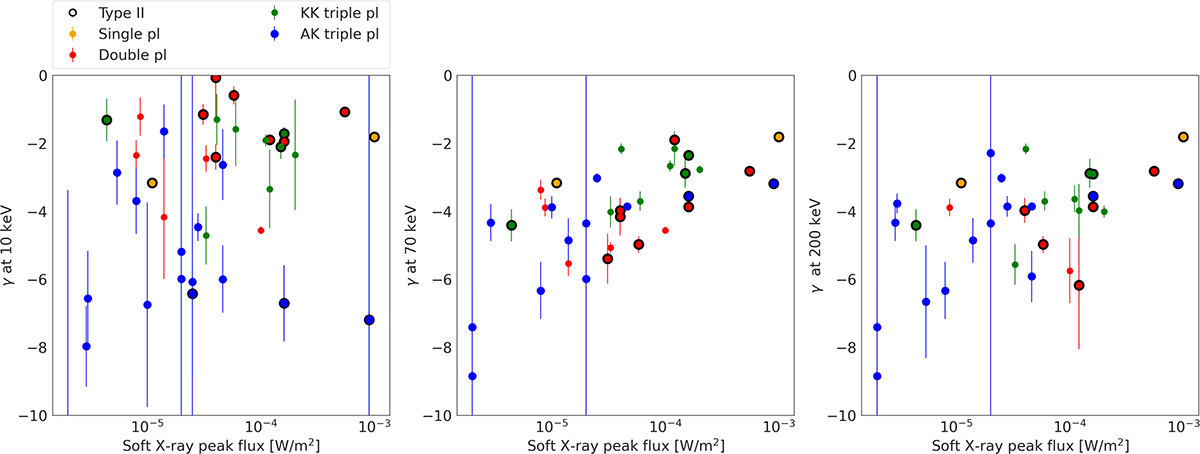
Download original image
Spectral index as a function of the soft X-ray peak flux of the associated flare. Left: Spectral index at a fixed energy of 10 keV. Middle: Spectral index at 70 keV. Right: Spectral index at 200 keV. The different colours represent different spectral shapes. Events accompanied by a type II burst are marked in black. Not all events are included in this plot, as we do not have a measurement for the soft X-ray peak flux for all events. In case the spectral index of the AK triple power law (blue), at any of the fixed energies, falls within the plateau region, we exclude it from this plot.
Current usage metrics show cumulative count of Article Views (full-text article views including HTML views, PDF and ePub downloads, according to the available data) and Abstracts Views on Vision4Press platform.
Data correspond to usage on the plateform after 2015. The current usage metrics is available 48-96 hours after online publication and is updated daily on week days.
Initial download of the metrics may take a while.