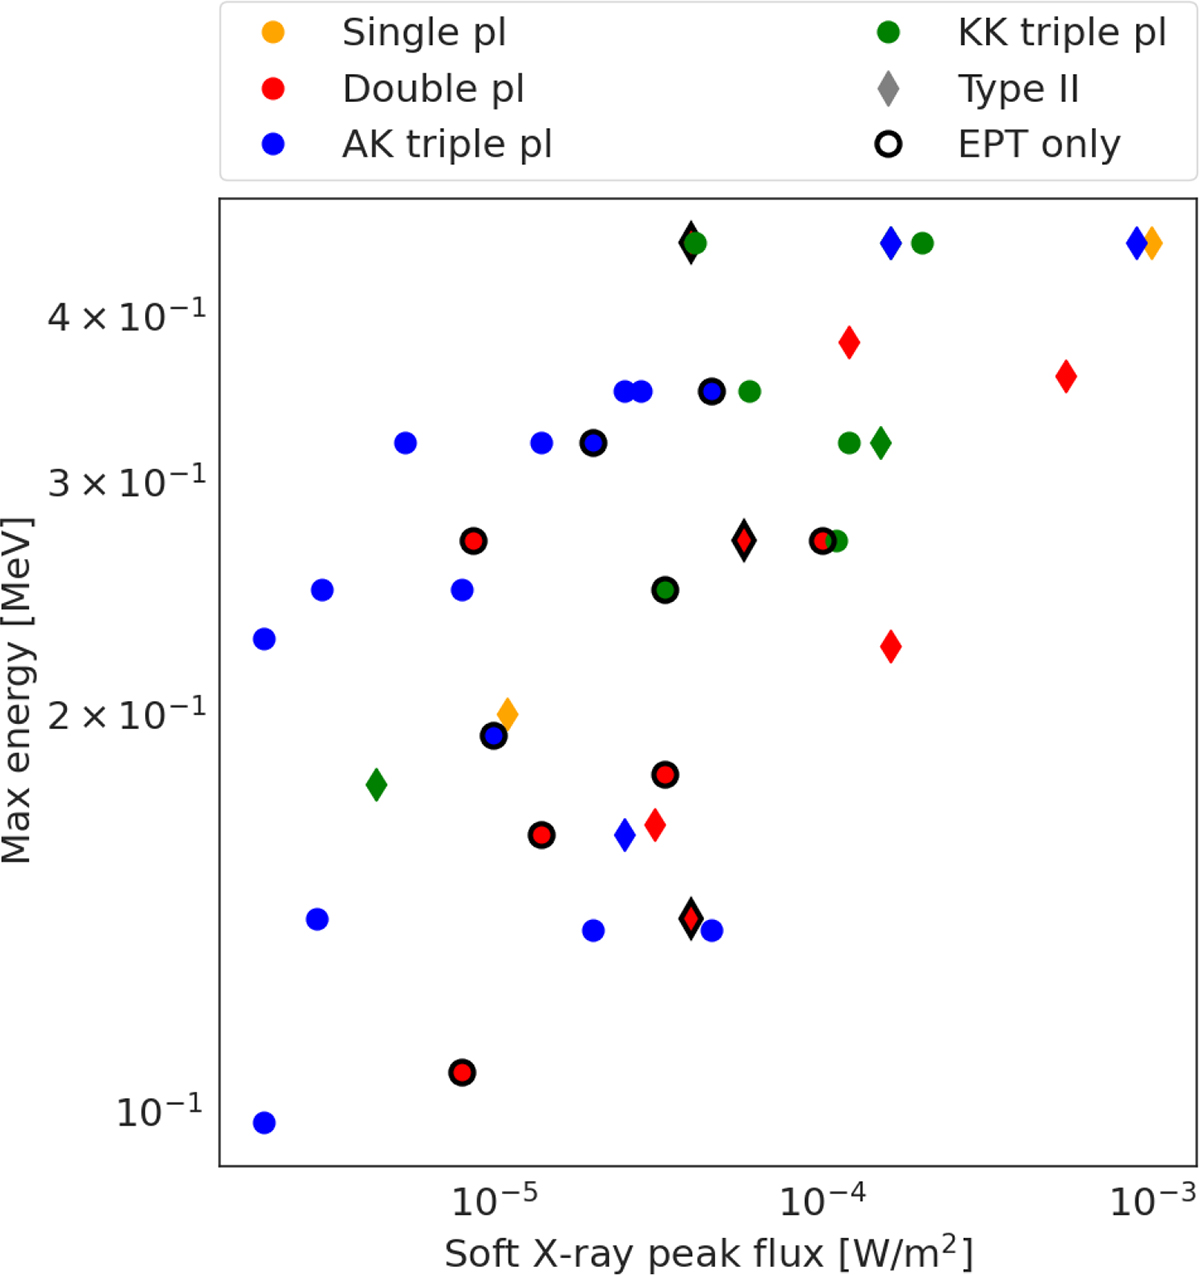
Fig. 9.
Download original image
Maximum energy at which each event is seen as a function of the soft X-ray peak flux of the associated flare. The different colours represent the different spectral shapes. Spectra analysed with EPT only are marked in black. The events with a type II radio burst are diamond shaped. Not all events are included in this plot, as we do not have a measurement for the soft X-ray peak flux for all events.
Current usage metrics show cumulative count of Article Views (full-text article views including HTML views, PDF and ePub downloads, according to the available data) and Abstracts Views on Vision4Press platform.
Data correspond to usage on the plateform after 2015. The current usage metrics is available 48-96 hours after online publication and is updated daily on week days.
Initial download of the metrics may take a while.