Fig. 1
Download original image
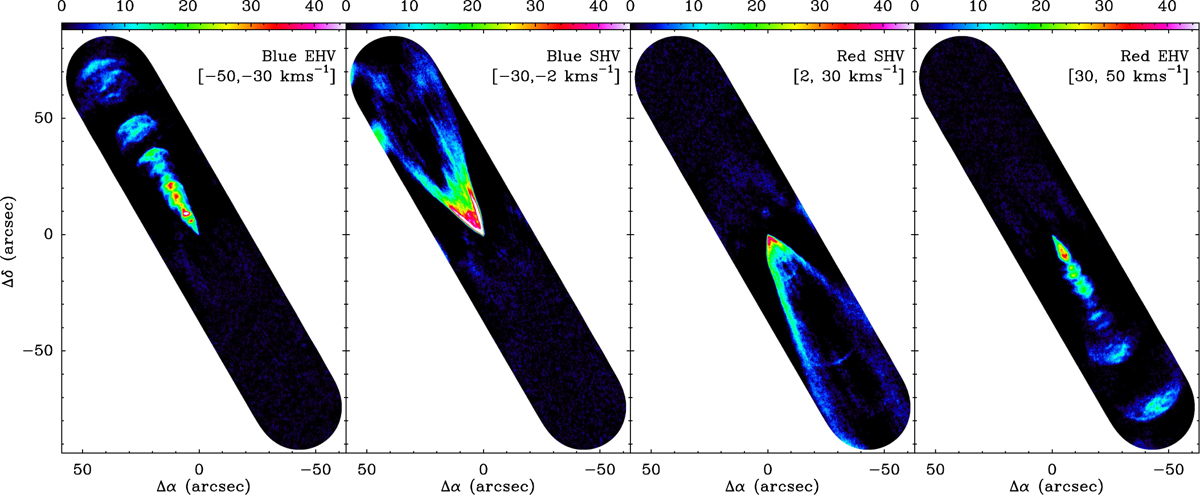
Maps of the CO(2–1) intensity integrated over the EHV and SHV velocity regimes. The velocity ranges of integration are given inside square brackets and are measured with respect to a cloud LSR velocity of 6.7 km s−1. The map coordinates are offsets measured with respect to the position of IRAS 04166, and the color intensity scales at the top are in units of K km s−1. We note the different geometry of the SHV and EHV components.
Current usage metrics show cumulative count of Article Views (full-text article views including HTML views, PDF and ePub downloads, according to the available data) and Abstracts Views on Vision4Press platform.
Data correspond to usage on the plateform after 2015. The current usage metrics is available 48-96 hours after online publication and is updated daily on week days.
Initial download of the metrics may take a while.