Open Access
Fig. A.5
Download original image
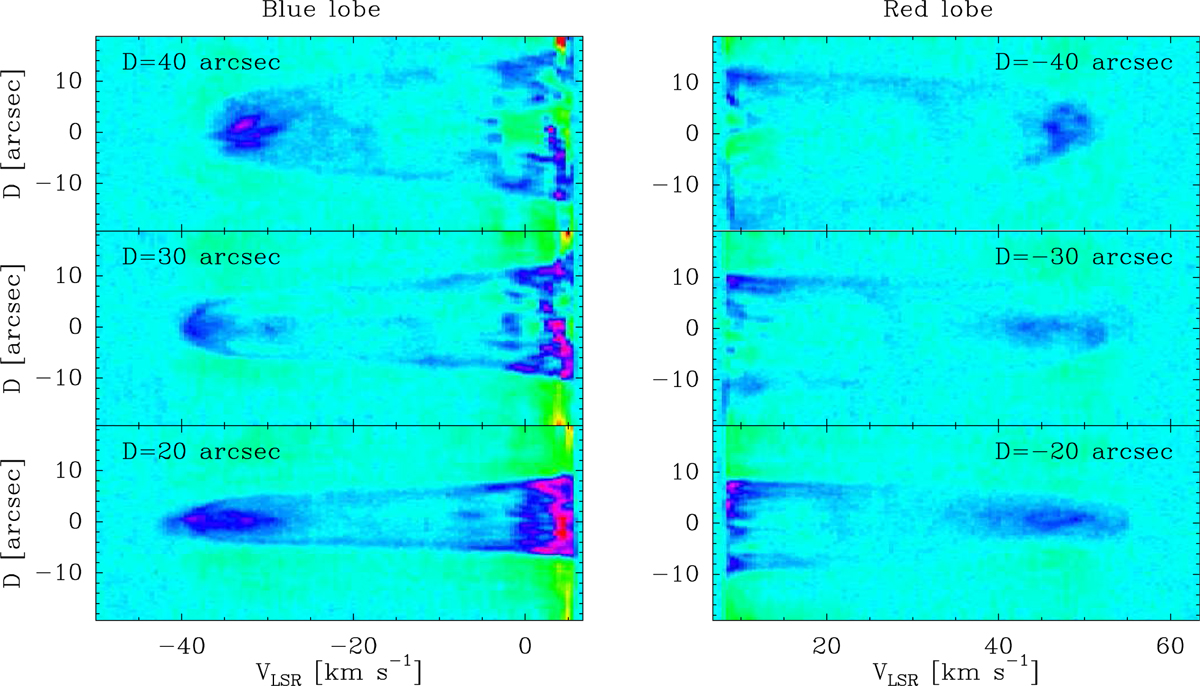
Position–velocity diagrams of the CO(2–1) emission perpendicular to the blue and red lobes of the IRAS 04166 outflow at 20″, 30″, and 40″ from the protostar. The weak emission inside the lobes hints at the presence of elliptical cavities indicative of nested outflow shells.
Current usage metrics show cumulative count of Article Views (full-text article views including HTML views, PDF and ePub downloads, according to the available data) and Abstracts Views on Vision4Press platform.
Data correspond to usage on the plateform after 2015. The current usage metrics is available 48-96 hours after online publication and is updated daily on week days.
Initial download of the metrics may take a while.