Fig. A.6
Download original image
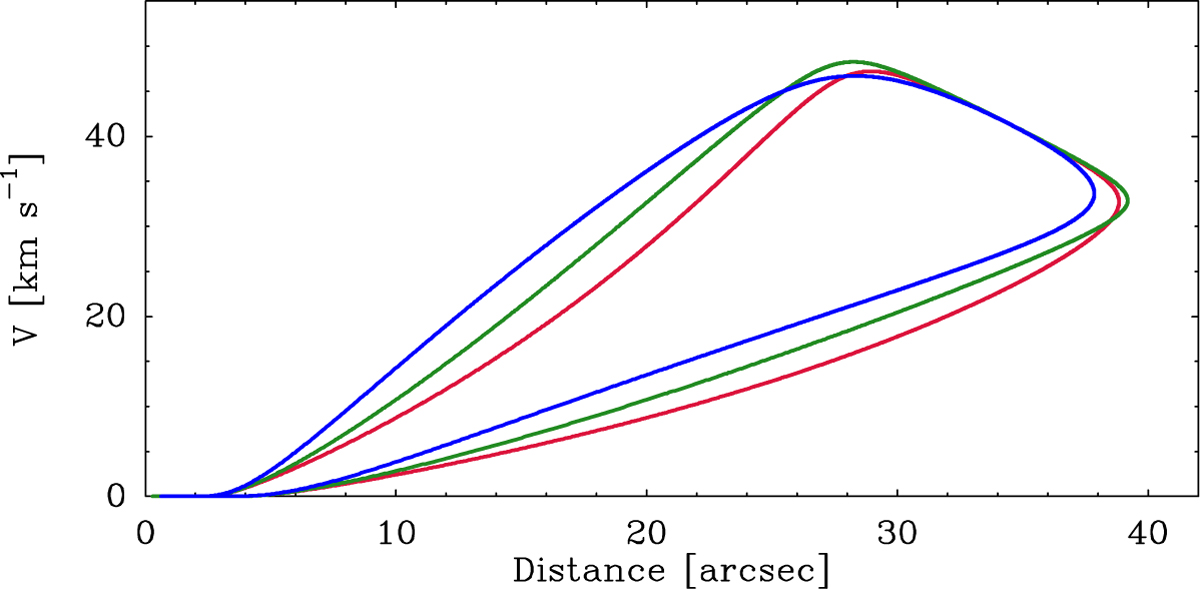
Position–velocity diagrams for single-event ejection models using three different density laws: r−2 (blue), r−1 (green), and no radial gradient (red). For easier comparison, all models have the same density at r = 4″. We note the similar shape of the diagrams and their overlap toward the top right region corresponding to the EHV component. This similarity indicates that the choice of density gradient has a minimal effect in the determination of the ejection model presented in Sect. 4.3. We also note that the steeper the gradient, the faster the gas moves along the PV fingers. This is a consequence of the lower density of the flow material encountered by the ejection. All models assume an inclination angle of 47° with respect to the line of sight, which corresponds to our preferred choice for the IRAS 04166 outflow (see text).
Current usage metrics show cumulative count of Article Views (full-text article views including HTML views, PDF and ePub downloads, according to the available data) and Abstracts Views on Vision4Press platform.
Data correspond to usage on the plateform after 2015. The current usage metrics is available 48-96 hours after online publication and is updated daily on week days.
Initial download of the metrics may take a while.