Fig. 3
Download original image
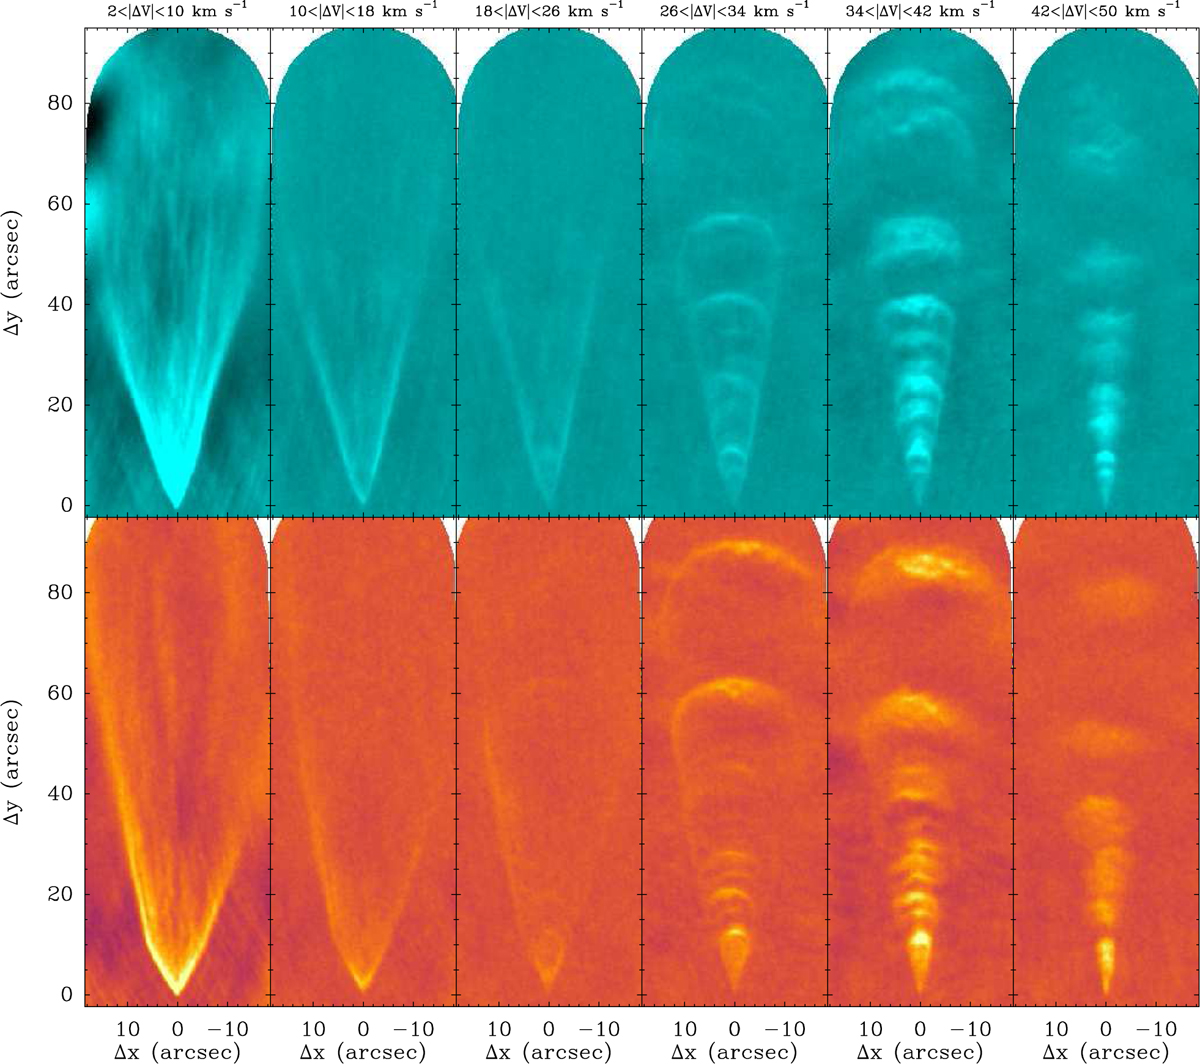
Maps of CO(2–1) intensity integrated over 8 km s−1 intervals to illustrate the different velocity regimes of the IRAS 04166 outflow. For easier comparison, the maps of blueshifted emission (top) have been rotated clockwise by ![]() , while the maps of redshifted emission (bottom) have been rotated by the same amount and reflected in the vertical direction. The interval of integration is given at the top and is measured with respect to the ambient LSR velocity of 6.7 km s−1. All maps are in linear scale with the extreme values adjusted for maximum contrast. The position of IRAS 04166 coincides with the origin of coordinates, and the blanked areas indicate regions not covered by the ALMA mosaic.
, while the maps of redshifted emission (bottom) have been rotated by the same amount and reflected in the vertical direction. The interval of integration is given at the top and is measured with respect to the ambient LSR velocity of 6.7 km s−1. All maps are in linear scale with the extreme values adjusted for maximum contrast. The position of IRAS 04166 coincides with the origin of coordinates, and the blanked areas indicate regions not covered by the ALMA mosaic.
Current usage metrics show cumulative count of Article Views (full-text article views including HTML views, PDF and ePub downloads, according to the available data) and Abstracts Views on Vision4Press platform.
Data correspond to usage on the plateform after 2015. The current usage metrics is available 48-96 hours after online publication and is updated daily on week days.
Initial download of the metrics may take a while.