Fig. 4
Download original image
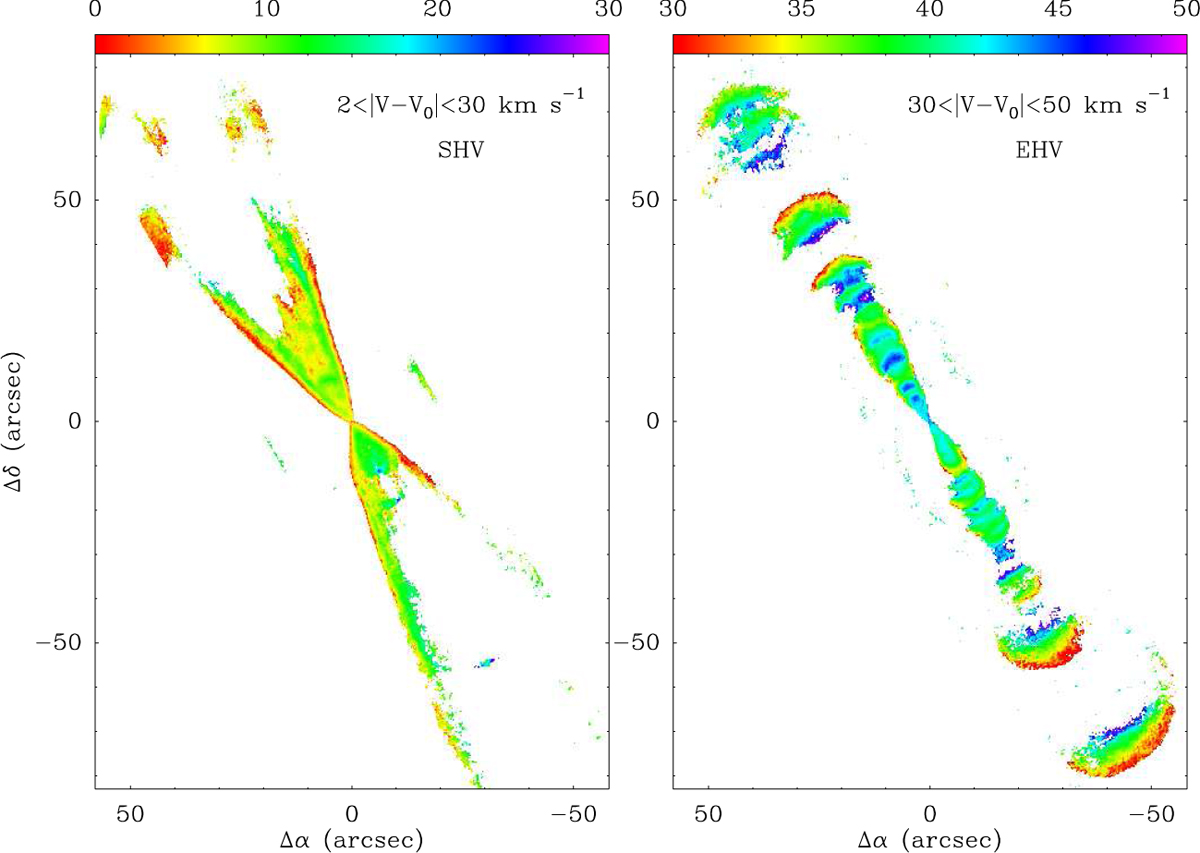
Maps of the absolute value of the velocity centroid of CO(2–1) for the SHV (left) and EHV (right) regimes. IRAS 04166 is located at the origin of coordinates, and the color scales at the top are in units of km s−1. We note the shear pattern in the SHV regime and the velocity oscillations along the outflow axis in the EHV regime.
Current usage metrics show cumulative count of Article Views (full-text article views including HTML views, PDF and ePub downloads, according to the available data) and Abstracts Views on Vision4Press platform.
Data correspond to usage on the plateform after 2015. The current usage metrics is available 48-96 hours after online publication and is updated daily on week days.
Initial download of the metrics may take a while.