Fig. 6
Download original image
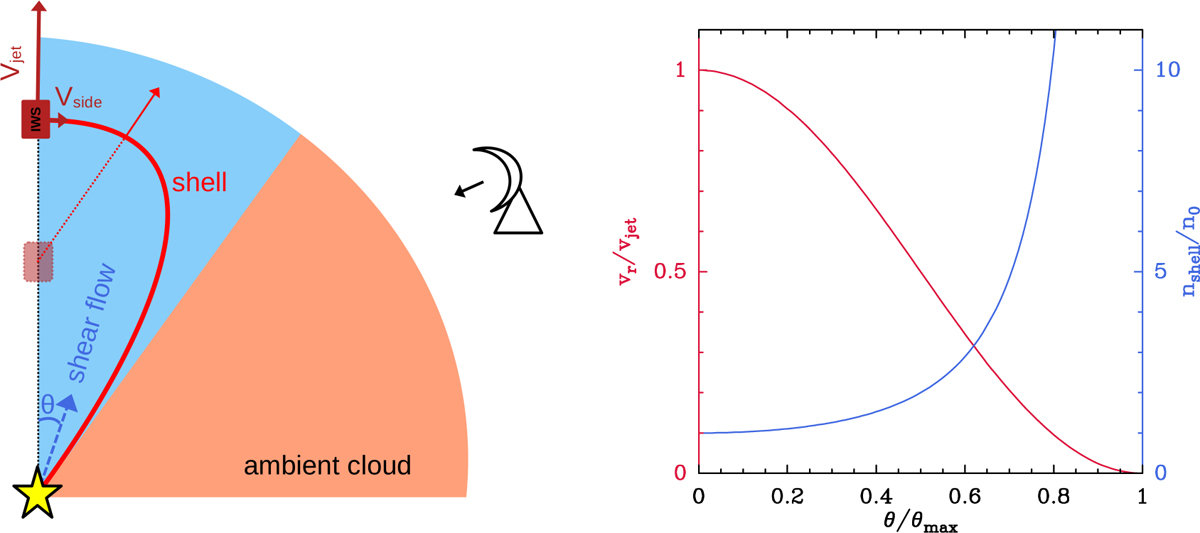
Left: geometry assumed for the simple model of lateral ejection from an internal working surface (IWS) presented in Sect. 4.2 (only one outflow quadrant is shown). The IWS moves along the y-axis with a constant vjet velocity and ejects gas with a vside perpendicular component. The ejected gas interacts with a surrounding shear flow and forms a shell that surrounds the jet axis (red solid curve). The plot shows the current location of the IWS (solid) and its position approximately half way along its path (dotted). The red dotted line represents the approximate trajectory between time of ejection and current time. The model predicts the expected PV diagram from an observation made at an arbitrary angle from the jet axis. Right: velocity and density profiles as a function of angle from the jet axis used to simulate the outflow shear flow. They correspond to Eqs. (1) and (2) in the text.
Current usage metrics show cumulative count of Article Views (full-text article views including HTML views, PDF and ePub downloads, according to the available data) and Abstracts Views on Vision4Press platform.
Data correspond to usage on the plateform after 2015. The current usage metrics is available 48-96 hours after online publication and is updated daily on week days.
Initial download of the metrics may take a while.