Fig. 7
Download original image
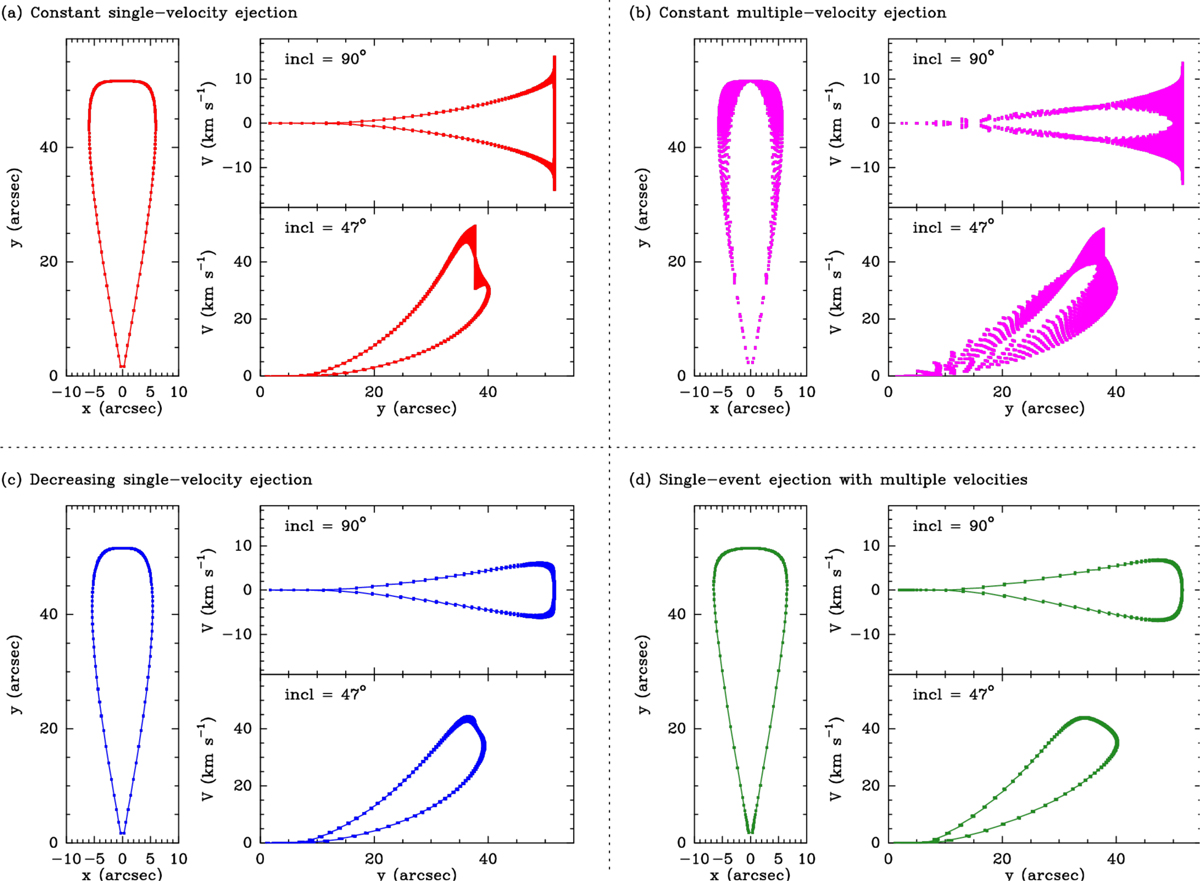
Summary of results from modeling four different modes of lateral ejection from a jet. Each mode is represented by a quadrant, and is labeled with its kinematic characteristics and color-coded for easier reference. In each quadrant, the vertical diagram represents a map of the ejected gas, and two horizontal diagrams are position–velocity plots for inclinations of 90° for a jet moving in the plane of sky and 47° for expected inclination of the IRAS 04166 outflow (see text for details).
Current usage metrics show cumulative count of Article Views (full-text article views including HTML views, PDF and ePub downloads, according to the available data) and Abstracts Views on Vision4Press platform.
Data correspond to usage on the plateform after 2015. The current usage metrics is available 48-96 hours after online publication and is updated daily on week days.
Initial download of the metrics may take a while.