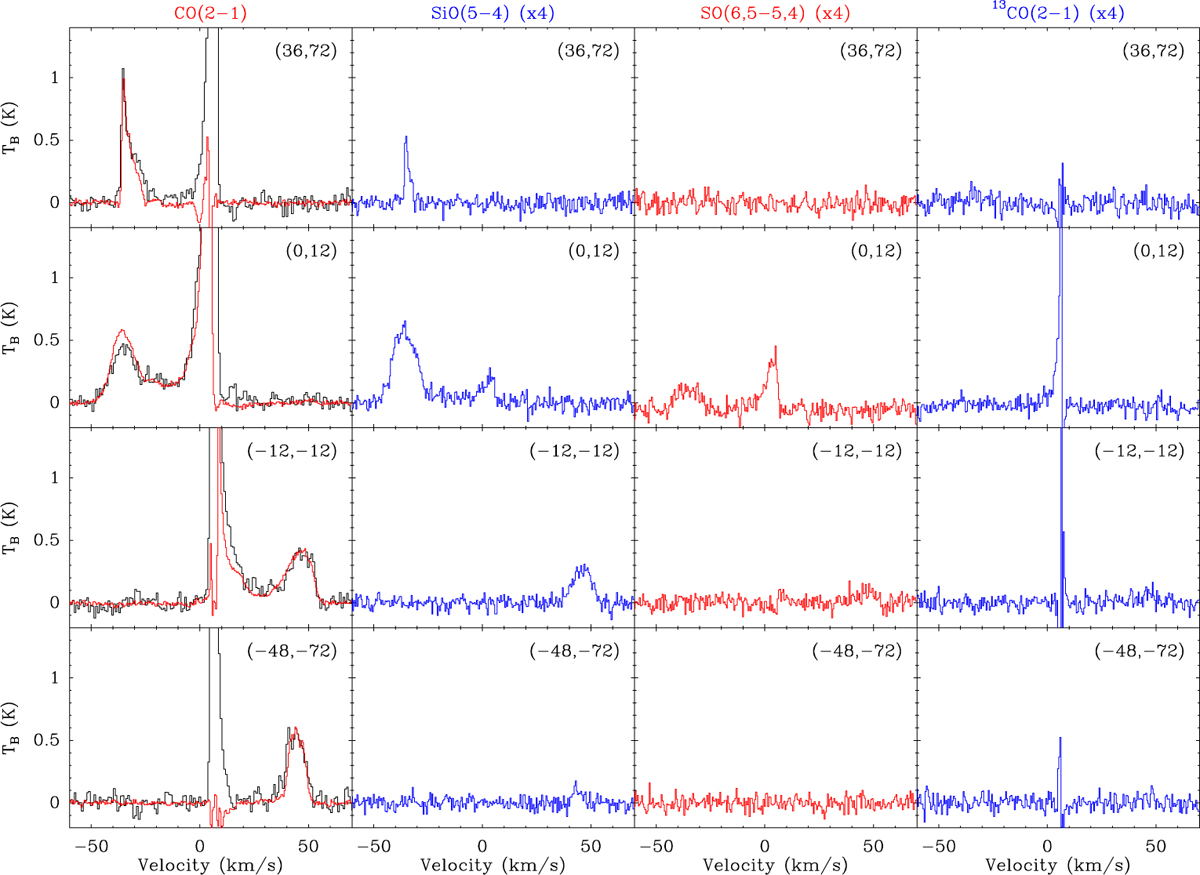
Fig. A.1
Download original image
Spectra of the four transitions observed with ALMA convolved to an angular resolution of 11″ to simulate an observation with the IRAM 30m telescope. For CO(2–1), the black lines represent actual IRAM 30m observations from Tafalla et al. (2004). We note how the ALMA data recover all the CO(2–1) single-dish flux in the EHV regime (|V − V0| > 30 km s−1, where V0 = 6.7 km s−1 is the cloud systemic velocity), but lose some flux within 10 km s−1 of the ambient cloud. The offsets given in the top right corners are in arcseconds with respect to the position of IRAS 04166.
Current usage metrics show cumulative count of Article Views (full-text article views including HTML views, PDF and ePub downloads, according to the available data) and Abstracts Views on Vision4Press platform.
Data correspond to usage on the plateform after 2015. The current usage metrics is available 48-96 hours after online publication and is updated daily on week days.
Initial download of the metrics may take a while.