Fig. D.5.
Download original image
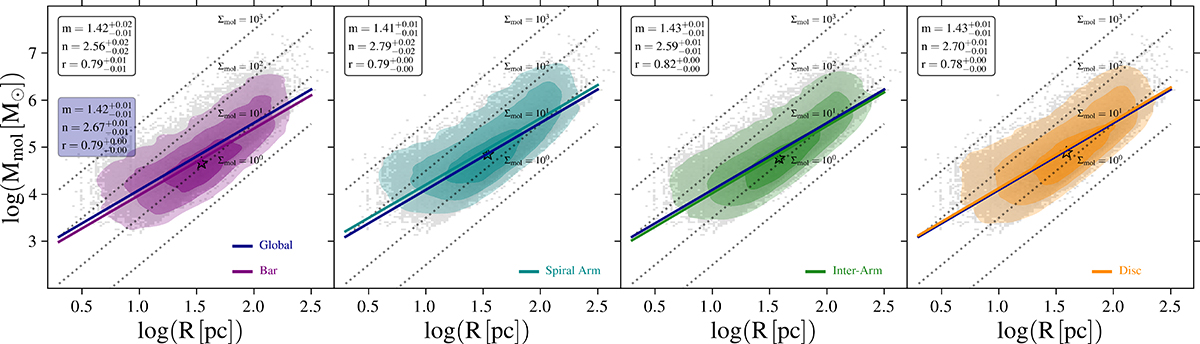
log(Mmol)-log(Req) scaling relation for the clouds in the different environments. Colored density contours represent 1, 2, and 3 σ contours in their corresponding galactic environments, and the stars show the median values. The solid line in each plot is a linear regression for the clouds in a specific environment. The slope and intercept are given by m and n, respectively, and the correlation coefficient is given by r. The 2D histogram of the full sample is shown in gray. The blue line represents the linear regression for the clouds regardless of environment, and its fit parameters are represented in the blue box in the leftmost plot. The diagonal dotted lines represent constant Σmol lines at 100, 101, 102, and 103 M⊙ pc−2.
Current usage metrics show cumulative count of Article Views (full-text article views including HTML views, PDF and ePub downloads, according to the available data) and Abstracts Views on Vision4Press platform.
Data correspond to usage on the plateform after 2015. The current usage metrics is available 48-96 hours after online publication and is updated daily on week days.
Initial download of the metrics may take a while.