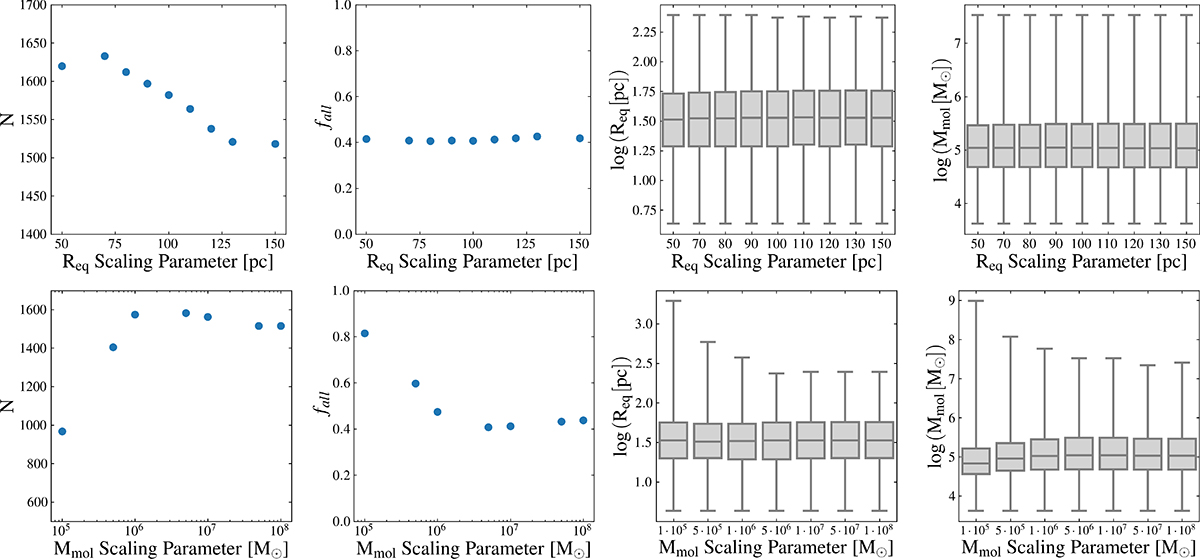
Fig. D.7.
Download original image
Top row: Variation in the total number of clouds (N), flux within the clouds relative to the total flux (fall), equivalent radius of the clouds (Req), and molecular mass of the clouds (Mmol) as a function of varying radius scaling parameter (from 50 to 150 pc), assuming a constant Mmol scaling parameter of 5 × 10⁶ M⊙. Bottom row: Same as the top row, but with a varying Mmol scaling parameter between 105 and 108 M⊙, assuming a constant Req scaling parameter of 100 pc. The box plots represent the median and the interquartile range of their distributions, and the whiskers cover the rest of the distribution. All results are shown for NGC 1385.
Current usage metrics show cumulative count of Article Views (full-text article views including HTML views, PDF and ePub downloads, according to the available data) and Abstracts Views on Vision4Press platform.
Data correspond to usage on the plateform after 2015. The current usage metrics is available 48-96 hours after online publication and is updated daily on week days.
Initial download of the metrics may take a while.