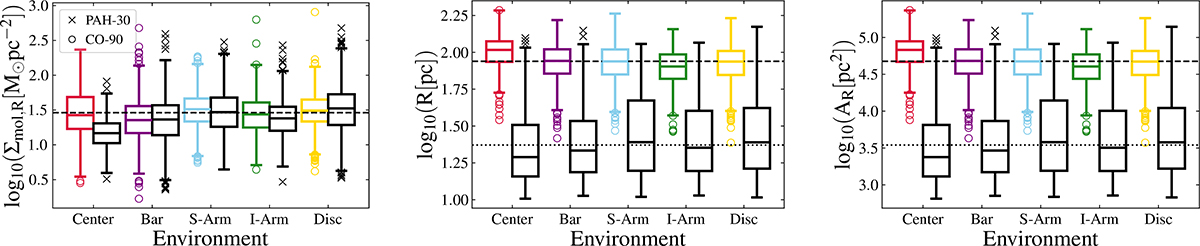
Fig. 3.
Download original image
Box plots with quantiles and outliers comparing the Σmol, R (left), cloud radius (middle), and cloud area (AR; right) distributions of cross-matched PAHs at 30 pc physical resolution and CO clouds at 90 pc in a subsample of 27 galaxies. The colored boxes represent the PAH cloud property distributions without overlapping clouds. The black boxes represent the property distributions of the cross-matched CO clouds. The dashed and dotted horizontal lines represent the median property of the full sample of CO clouds and PAH clouds, respectively.
Current usage metrics show cumulative count of Article Views (full-text article views including HTML views, PDF and ePub downloads, according to the available data) and Abstracts Views on Vision4Press platform.
Data correspond to usage on the plateform after 2015. The current usage metrics is available 48-96 hours after online publication and is updated daily on week days.
Initial download of the metrics may take a while.