Open Access
Fig. 4.
Download original image
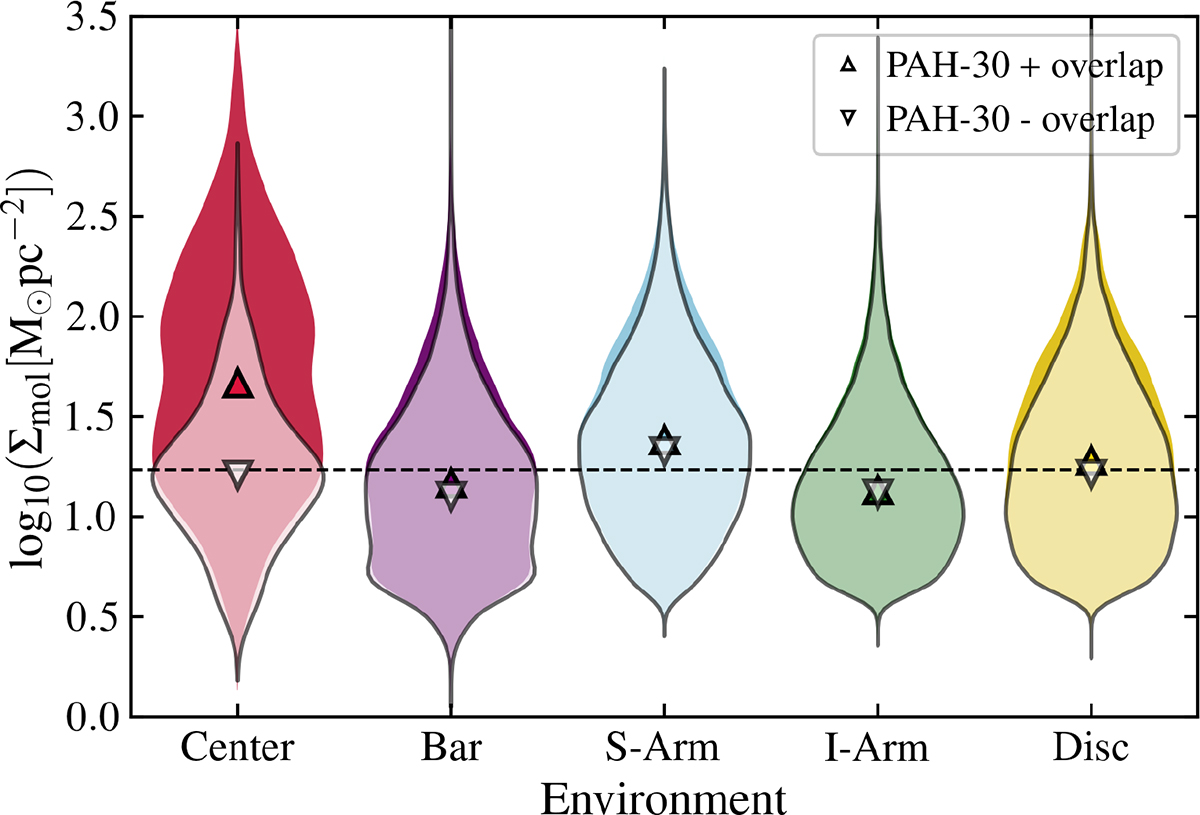
Violin plots showing the distribution and medians of Σmol in each galactic environment for the full sample of PAH clouds (colored) and the 77 844 clouds without overlap (transparent) in the 66 galaxies. The dashed line represents the median Σmol for the full PAH cloud sample.
Current usage metrics show cumulative count of Article Views (full-text article views including HTML views, PDF and ePub downloads, according to the available data) and Abstracts Views on Vision4Press platform.
Data correspond to usage on the plateform after 2015. The current usage metrics is available 48-96 hours after online publication and is updated daily on week days.
Initial download of the metrics may take a while.