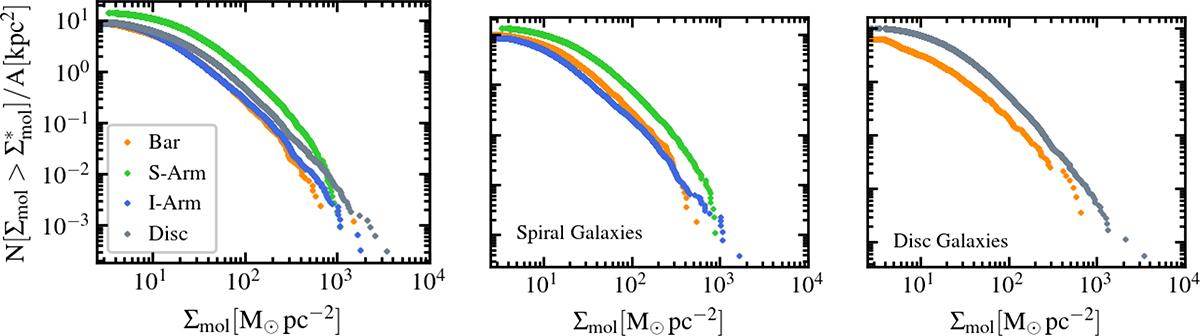
Fig. 5.
Download original image
Left: Cumulative distributions of the molecular mass surface densities from the full cloud sample. The different colors represent the different environments. The y-axis is the fraction of clouds with a surface density greater than a given value. All distributions are normalized by the total area of their specific environment, A. Middle: Same as the left plot, but only considering barred spiral galaxies and excluding disks. Right: Same as the left plot, but only considering barred disk galaxies and excluding spirals. We removed the central region from the PDFs due to overlapping cloud bias.
Current usage metrics show cumulative count of Article Views (full-text article views including HTML views, PDF and ePub downloads, according to the available data) and Abstracts Views on Vision4Press platform.
Data correspond to usage on the plateform after 2015. The current usage metrics is available 48-96 hours after online publication and is updated daily on week days.
Initial download of the metrics may take a while.